Radar chart examples
Explore six radar chart examples comparing skills, products, player profiles, satisfaction and personal reflection. Each spider chart uses explicitly defined, shared-scale ratings and includes the data, an editable version and guidance on avoiding misleading comparisons.
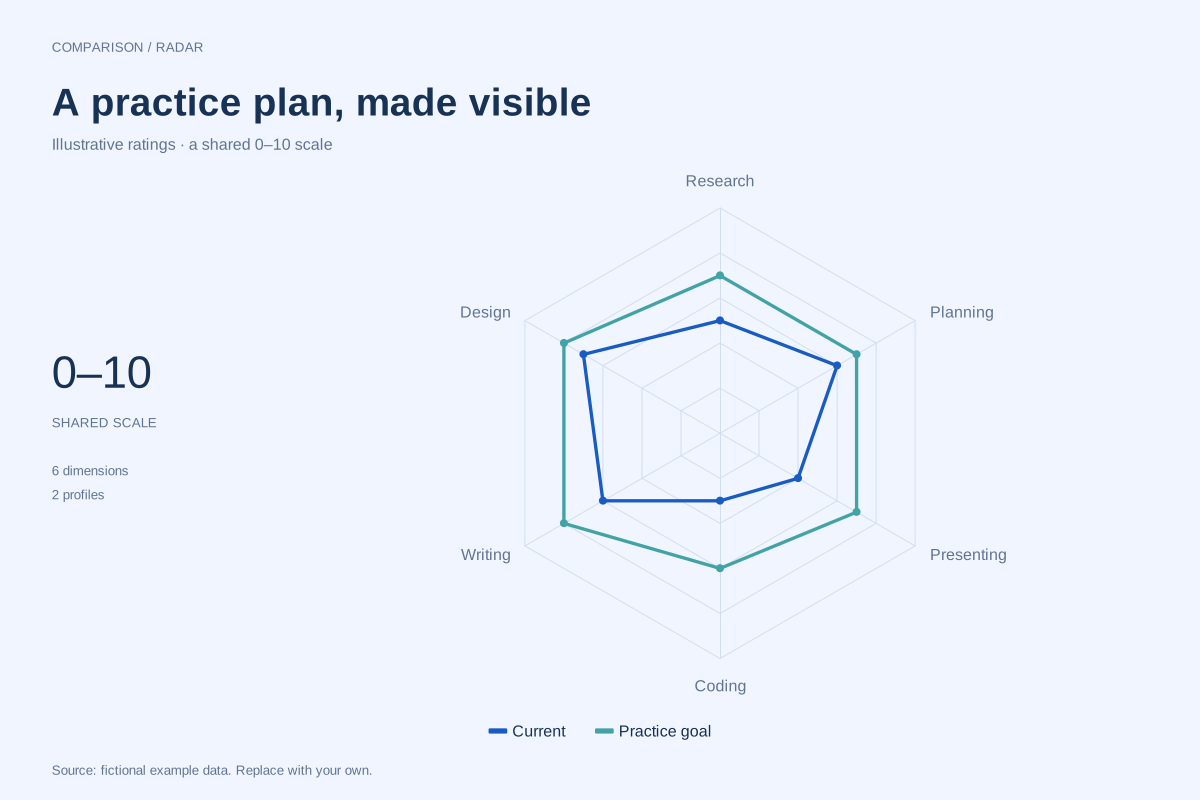
Radar chart · Worked exampleA skills radar chart compares ratings across several named capabilities on a common scale. This fictional example places current self-ratings beside practice goals for six skills, making the gaps available for discussion.
Editable chart + original data 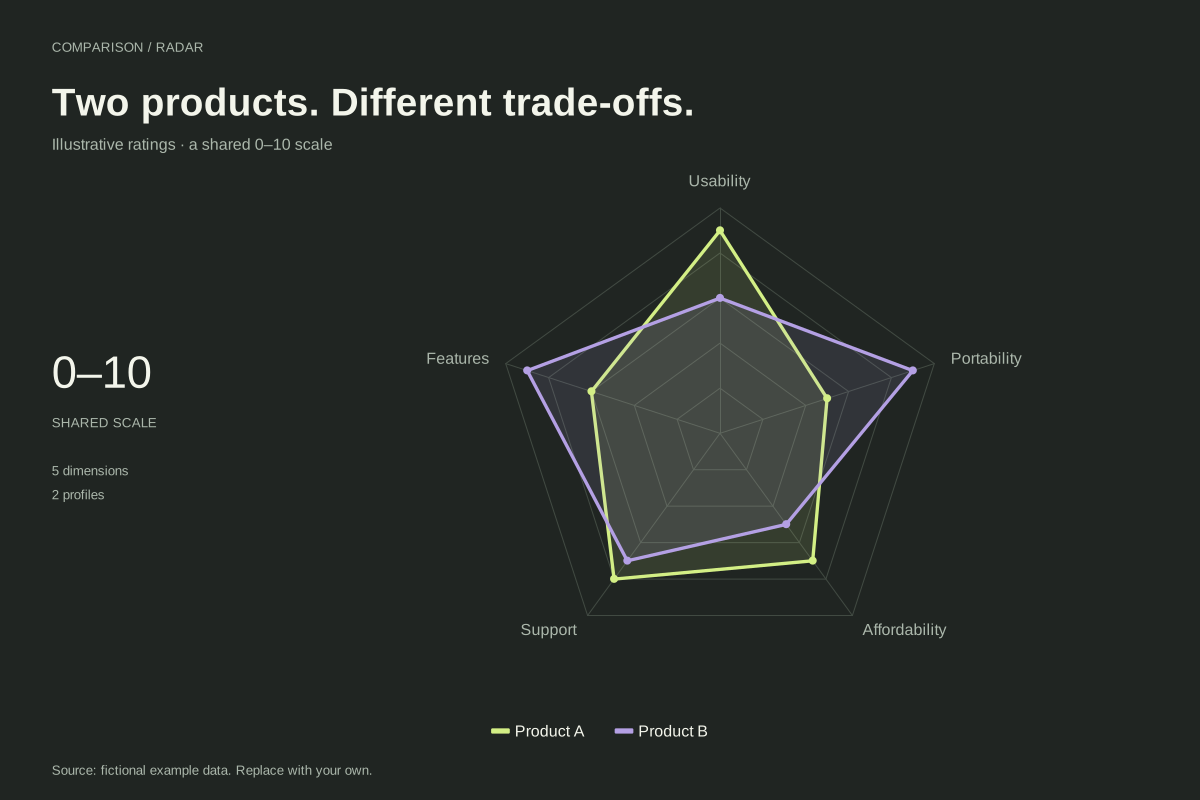
Radar chart · Worked exampleA product comparison radar chart displays two products across a shared set of rated criteria. This fictional example compares usability, features, support, affordability and portability on a common 0–10 scale.
Editable chart + original data 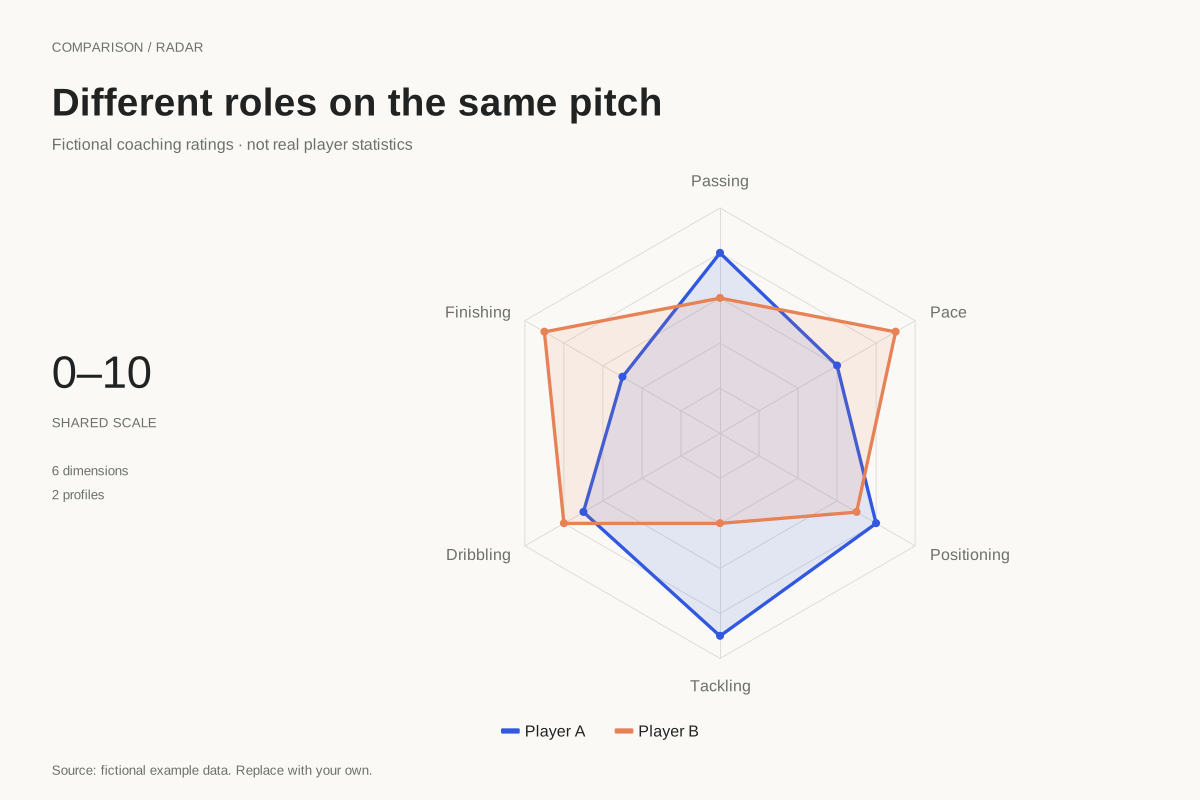
Radar chart · Worked exampleA football radar chart compares profiles across named dimensions. This example uses fictional coaching ratings for two players across passing, finishing, dribbling, tackling, positioning and pace, all on a shared 0–10 scale.
Editable chart + original data 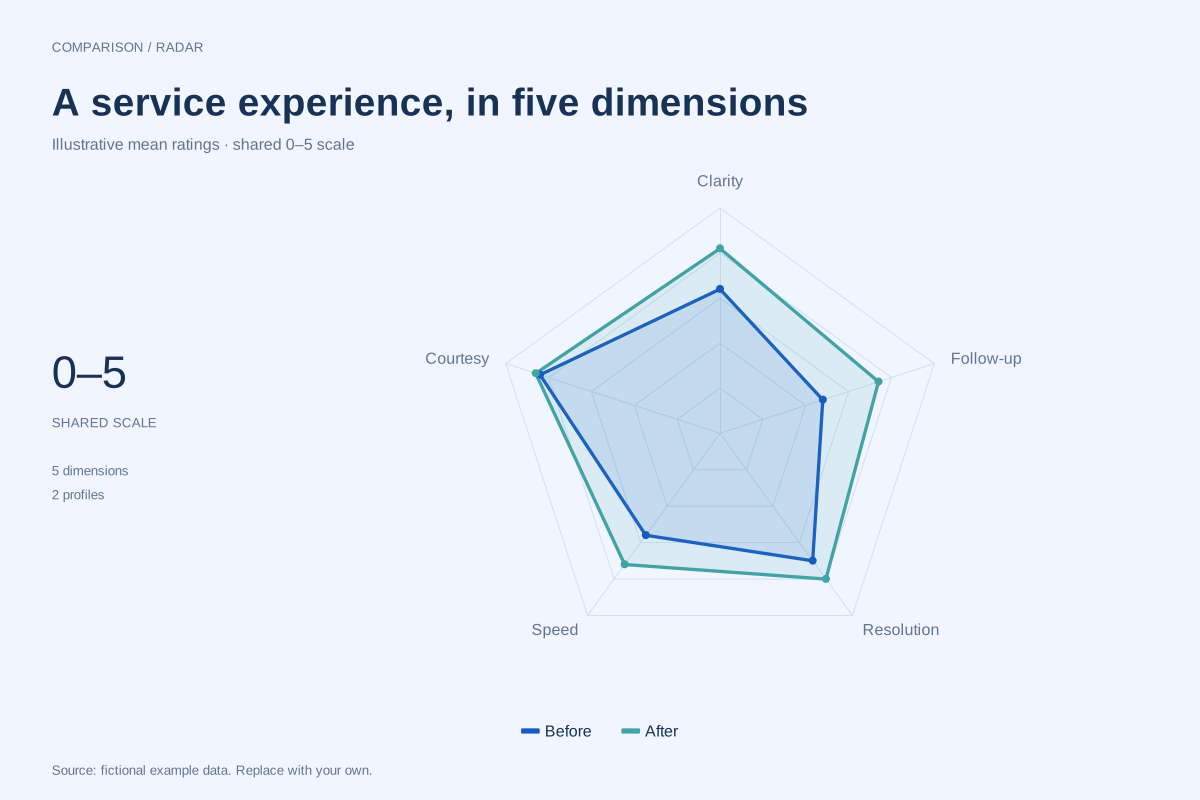
Radar chart · Worked exampleA customer satisfaction radar chart compares ratings for different parts of an experience. This fictional before-and-after example uses a common 0–5 plotting scale across clarity, courtesy, speed, resolution and follow-up.
Editable chart + original data 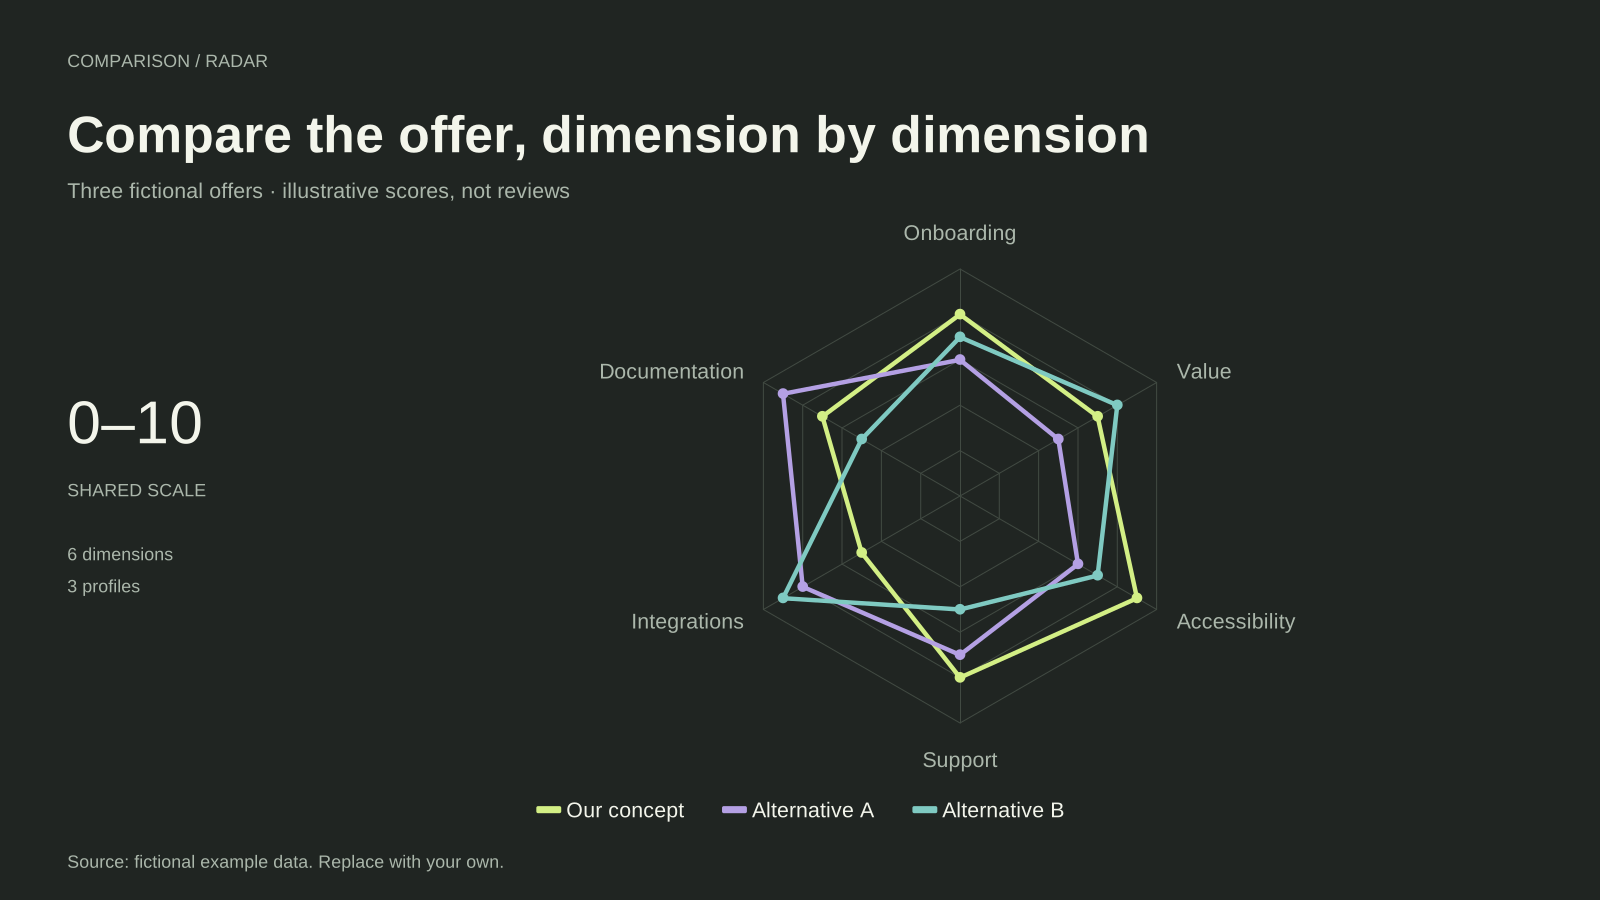
Radar chart · Worked exampleA competitor analysis radar chart compares several offers against the same criteria. This editable example uses three fictional profiles across onboarding, documentation, integrations, support, accessibility and value.
Editable chart + original data 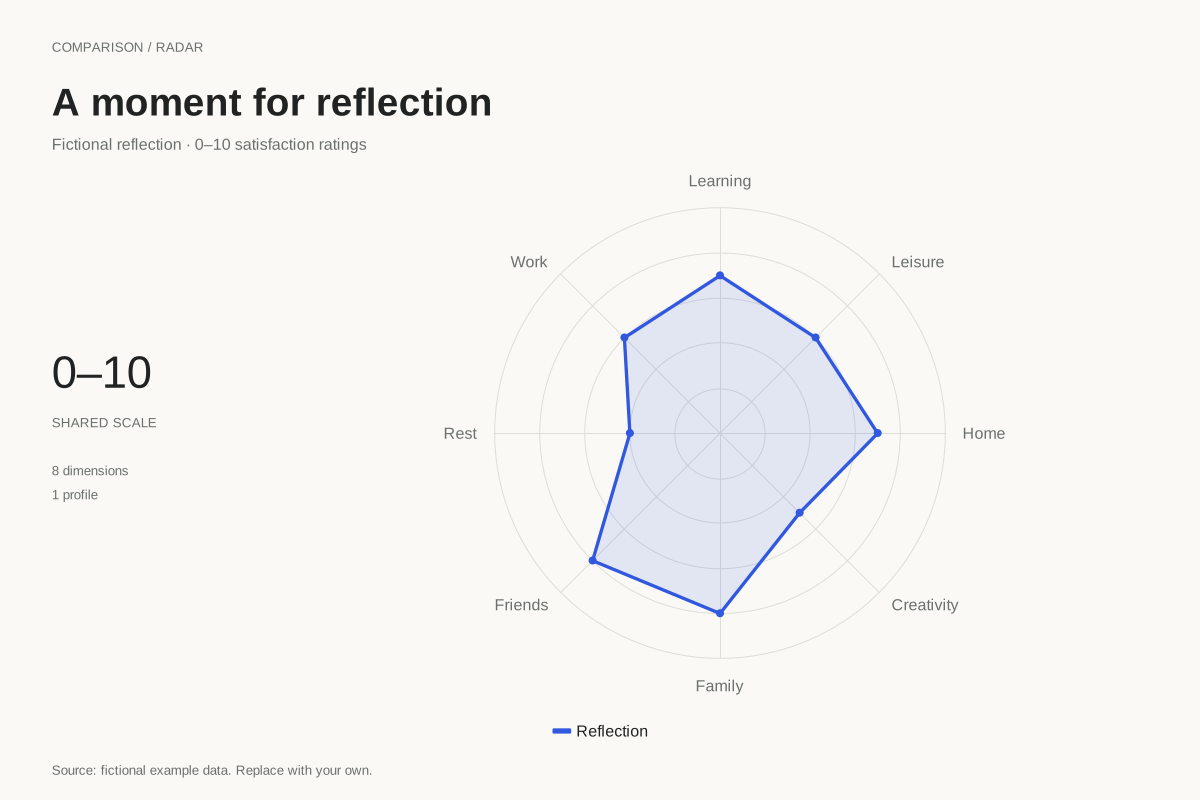
Radar chart · Worked exampleA wheel of life chart places personal reflection ratings around a circle. This example uses a radar polygon with eight fictional 0–10 satisfaction ratings, offering a starting point for a private reflection exercise.
Editable chart + original data A common scale needs a clear meaning
Radar axes must have comparable numeric ranges and an explicit scoring direction. A raw price and a count of features do not become comparable simply because they appear on the same polygon. These examples use fictional ratings and state where a rubric or transformation would be needed for real evidence.
Compare dimensions, not polygon area
Look at individual axes and differences between the series. Reordering axes can change the shape and enclosed area without changing the ratings. None of these examples treats area as an overall score, declares an objective winner or supplies unsupported product or player reviews.
Keep context with the download
Choose an example to see its scale, interpretation and limitations. Open the exact profile in the free radar chart maker to replace labels and values. Use the source note to describe your own evidence, and keep the same axes and maximum when comparing later observations.
Open the free radar chart maker
Browse all 50 chart examples