Start with data
you can trace.
Five public UCI datasets, prepared for chart exploration with source attribution, pinned files and explicit selection notes. Download the full CSV or open the documented chart selection.
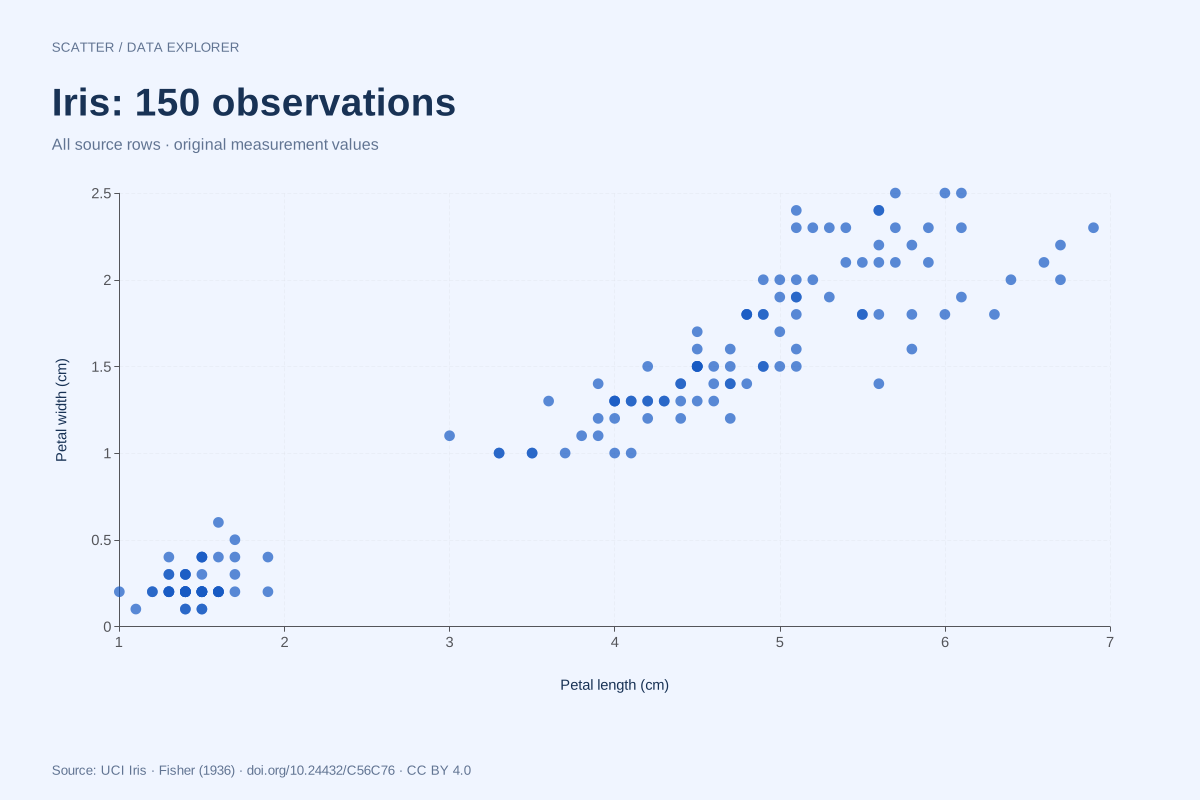
Iris
Download the UCI Iris data as a headered CSV and inspect petal length against petal width. This resource pins bezdekIris.data, keeps all 150 source rows, and identifies the version so the plotted values can be reproduced.
150 full rows · 150 plotted rows · CC BY 4.0
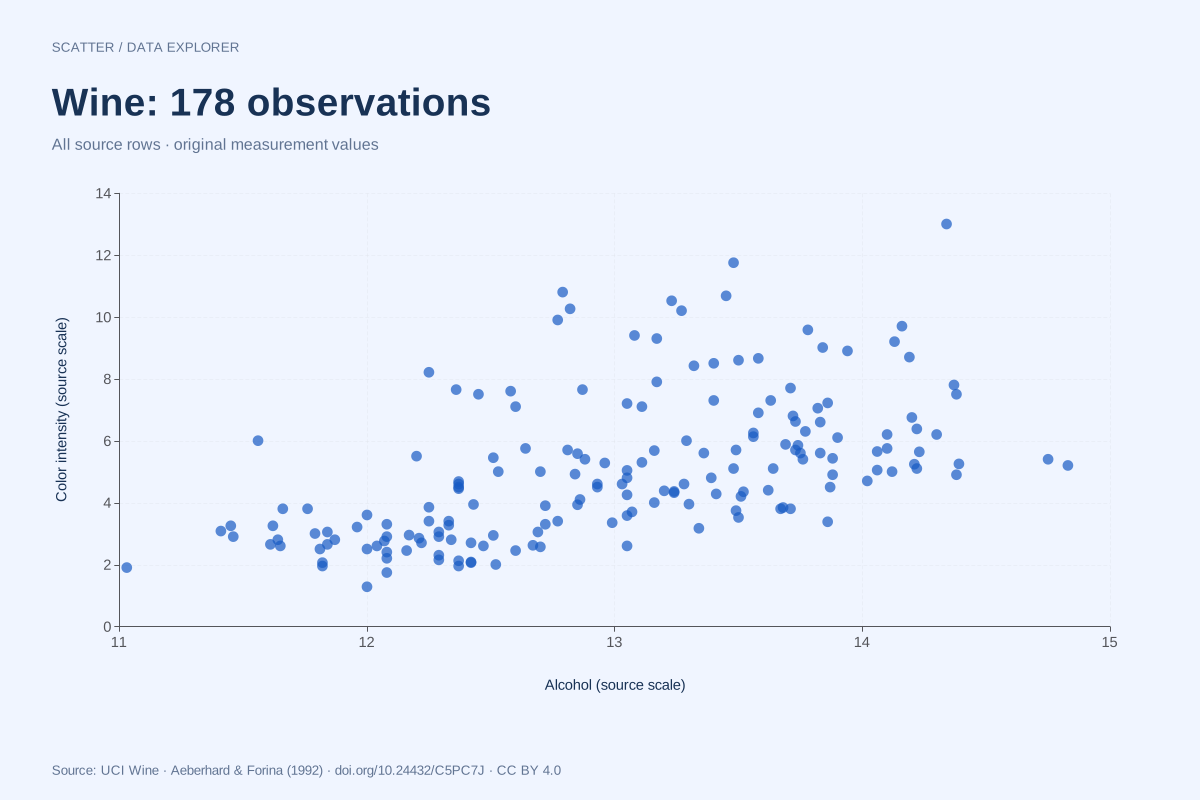
Wine
Use the UCI Wine CSV to explore 178 observations with a class label and thirteen chemical measurements. The ready-to-chart file selects alcohol and color intensity without standardizing or rescaling either column.
178 full rows · 178 plotted rows · CC BY 4.0
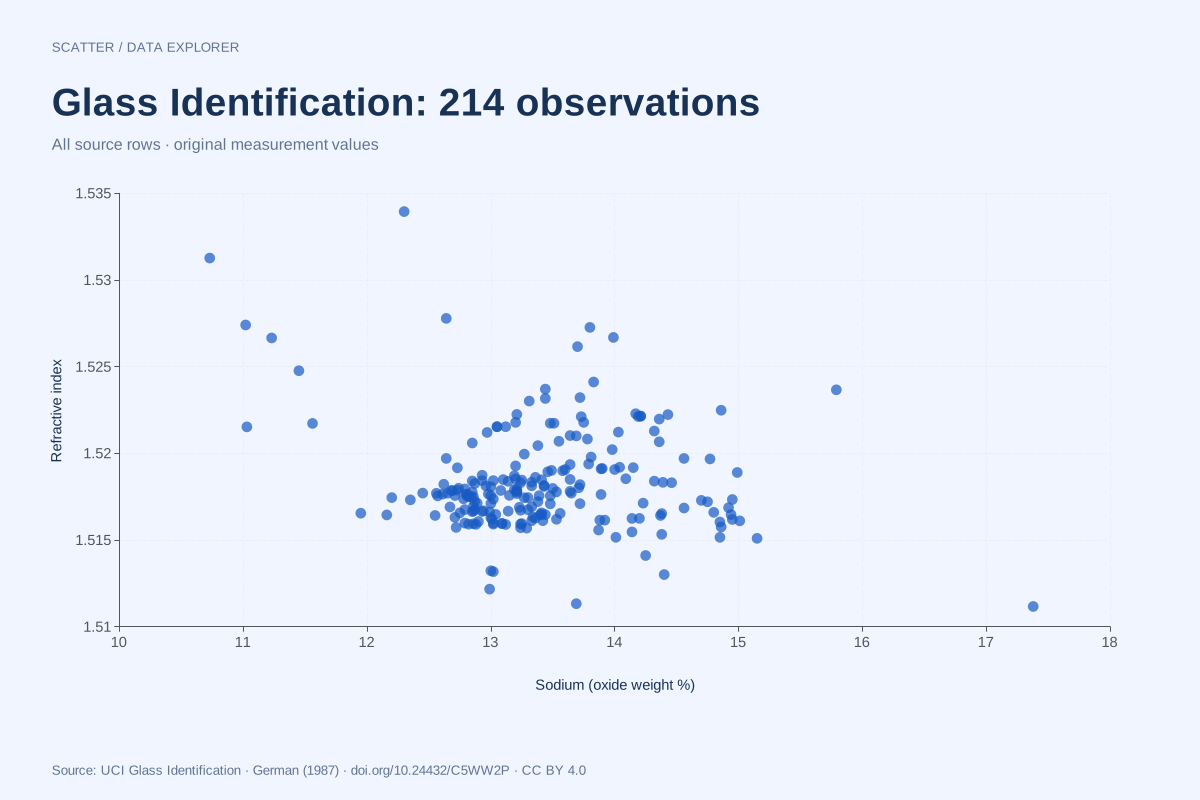
Glass Identification
Explore all 214 rows of the UCI Glass Identification data. The chart pairs sodium content with refractive index, while the full CSV keeps the record identifier, nine measurements and glass class code.
214 full rows · 214 plotted rows · CC BY 4.0
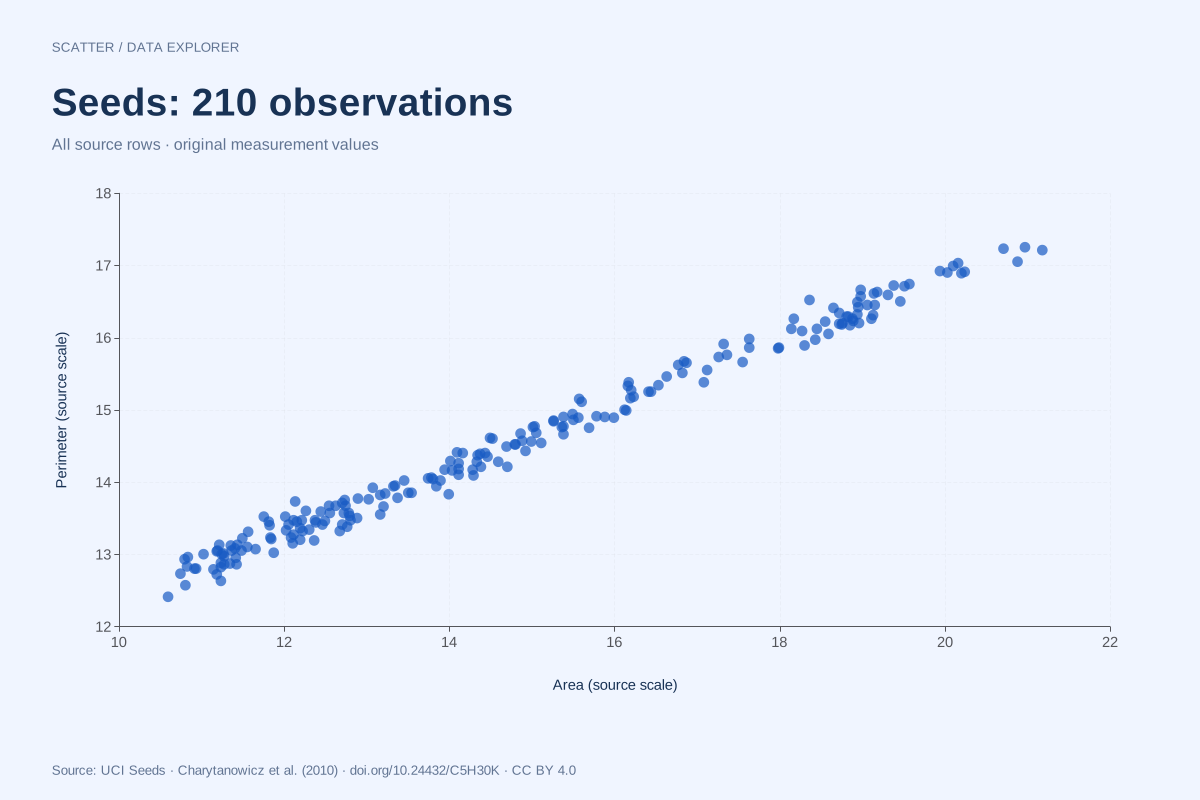
Seeds
Download the 210-row UCI Seeds dataset with column headers and a ready-to-chart area–perimeter pair. The conversion preserves the original whitespace-separated values and adds names without changing the observations.
210 full rows · 210 plotted rows · CC BY 4.0
Abalone
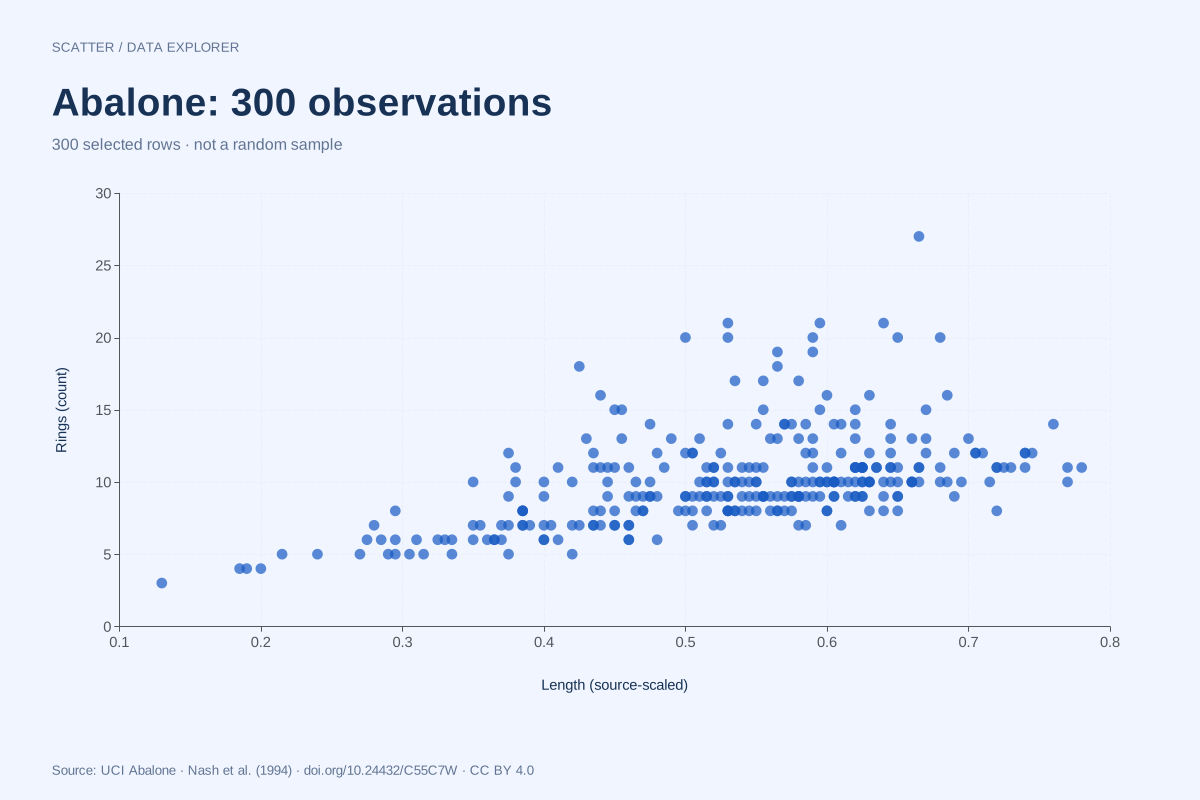
Download all 4,177 UCI Abalone records, or use the explicitly labelled 300-row chart subset. The scatter pairs the supplied length value with ring count; it does not silently trim a full-data upload to fit the editor.
4,177 full rows · 300 plotted rows · CC BY 4.0
What preparation means here
ChartsAI adds headers and CSV formatting while preserving the supplied numeric values. Each resource identifies the original file, retrieval date and SHA-256 checksum. Its chart uses two named columns, with every selected source row recorded in the provenance download. Four charts use all source rows. Abalone uses a clearly labelled 300-row deterministic selection because the full file exceeds the editor limit; it is not a random sample.
Use the source context with the chart
A public dataset is evidence of the supplied observations, not a guarantee that a particular analysis or population claim is appropriate. Read the variable definitions, prior preprocessing and limitations before combining units, interpreting class labels or describing a relationship. Original data remain subject to their CC BY 4.0 attribution terms. Our fictional worked examples form a separate teaching collection.
Choose the right representation or open the scatter plot maker with your own paired measurements.