What the columns mean
The first source column is a class identifier, followed by thirteen measurements. The repository describes three cultivars from one Italian region. Its variable table does not supply units for the selected alcohol and color-intensity fields; this resource keeps the original values and does not invent units.
What this chart helps you inspect
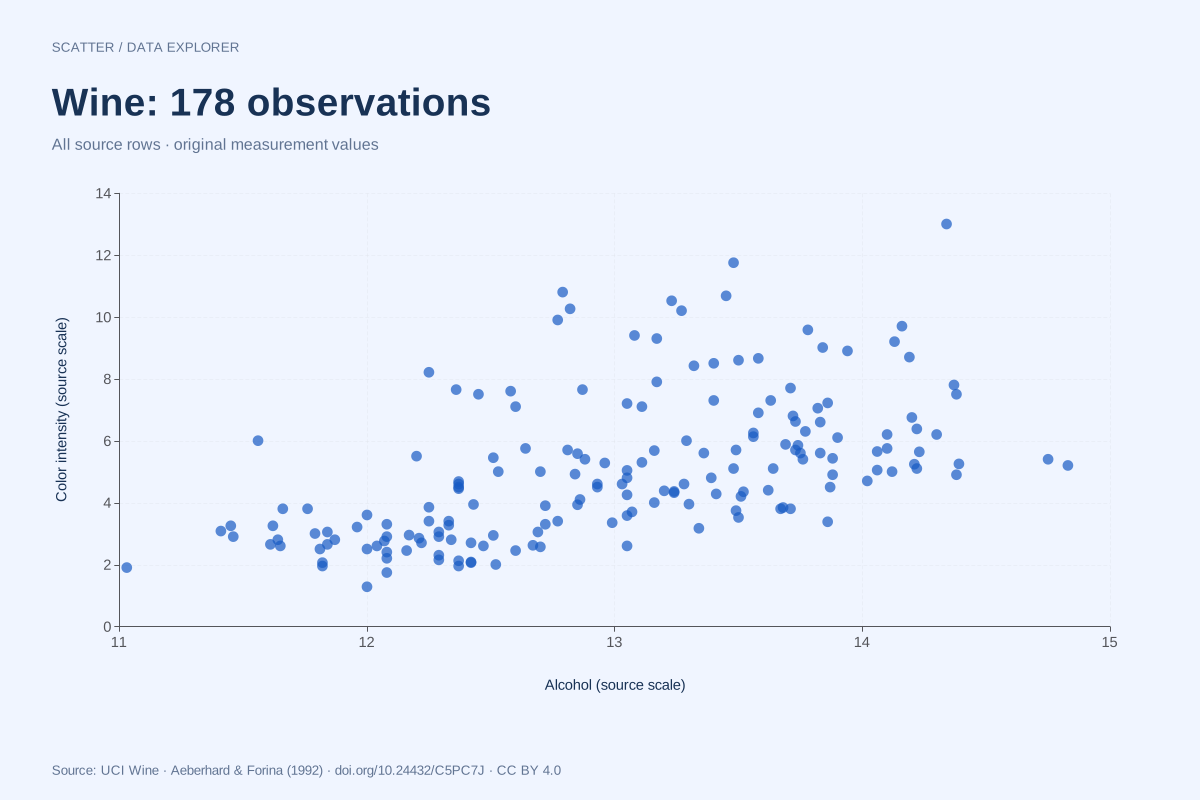
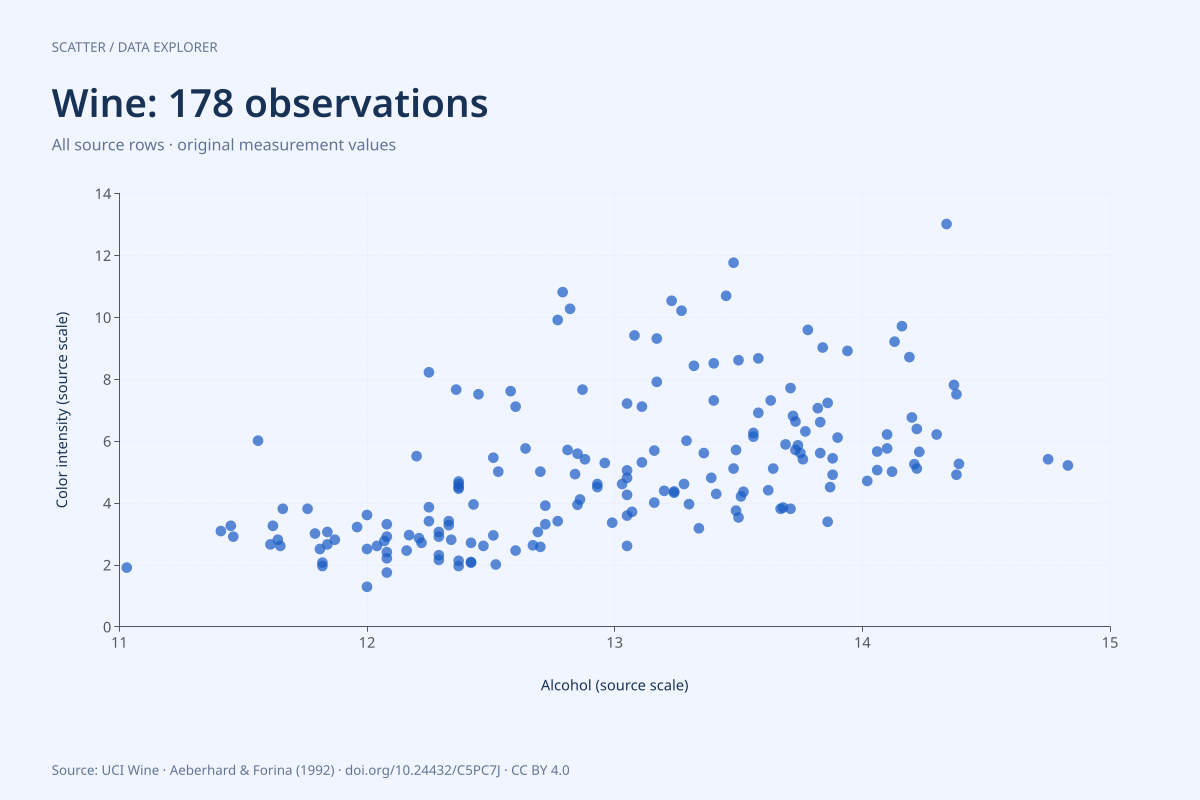
The scatter pairs alcohol with color intensity in source row order. The class code remains in the full CSV, not on either numeric axis. Treating codes 1, 2 and 3 as a continuous measurement would create an arbitrary numerical relationship. For a follow-up, split the paired data by class and compare the within-class pattern with the pooled picture.
Limits of this resource
The sample is a historical classification dataset, not a quality ranking or a representative survey of wines. No tasting score or market outcome is supplied. A visually separated group would not establish that one cultivar is better or that alcohol causes color intensity.
Calculated from the plotted rows
| Variable | N | Minimum | Maximum | Mean |
|---|---|---|---|---|
| alcohol | 178 | 11.03 | 14.83 | 13.0006 |
| color_intensity | 178 | 1.28 | 13 | 5.05809 |
These descriptive values are computed from the chart CSV at build time. Displayed means use up to six significant digits; downloaded measurements retain their original precision. They summarize the plotted selection only and are not population estimates. No rows are removed during chart preparation beyond the explicit selection rule above.
Preview of the full CSV
The first eight source rows are shown here; the download contains the complete 178-row file with a header.
| class | alcohol | malic_acid | ash | alcalinity_of_ash | magnesium | total_phenols | flavanoids | nonflavanoid_phenols | proanthocyanins | color_intensity | hue | od280_od315 | proline |
|---|---|---|---|---|---|---|---|---|---|---|---|---|---|
| 1 | 14.23 | 1.71 | 2.43 | 15.6 | 127 | 2.8 | 3.06 | .28 | 2.29 | 5.64 | 1.04 | 3.92 | 1065 |
| 1 | 13.2 | 1.78 | 2.14 | 11.2 | 100 | 2.65 | 2.76 | .26 | 1.28 | 4.38 | 1.05 | 3.4 | 1050 |
| 1 | 13.16 | 2.36 | 2.67 | 18.6 | 101 | 2.8 | 3.24 | .3 | 2.81 | 5.68 | 1.03 | 3.17 | 1185 |
| 1 | 14.37 | 1.95 | 2.5 | 16.8 | 113 | 3.85 | 3.49 | .24 | 2.18 | 7.8 | .86 | 3.45 | 1480 |
| 1 | 13.24 | 2.59 | 2.87 | 21 | 118 | 2.8 | 2.69 | .39 | 1.82 | 4.32 | 1.04 | 2.93 | 735 |
| 1 | 14.2 | 1.76 | 2.45 | 15.2 | 112 | 3.27 | 3.39 | .34 | 1.97 | 6.75 | 1.05 | 2.85 | 1450 |
| 1 | 14.39 | 1.87 | 2.45 | 14.6 | 96 | 2.5 | 2.52 | .3 | 1.98 | 5.25 | 1.02 | 3.58 | 1290 |
| 1 | 14.06 | 2.15 | 2.61 | 17.6 | 121 | 2.6 | 2.51 | .31 | 1.25 | 5.05 | 1.06 | 3.58 | 1295 |
Source, version and reuse
S. Aeberhard and M. Forina (1992). Wine [Dataset]. UCI Machine Learning Repository. 10.24432/C5PC7J. Licensed CC BY 4.0. Retain attribution and identify changes when reusing.
ChartsAI adds column headers and CSV formatting, selects the declared chart columns and rows, and generates the visual and summaries. Original numeric strings are preserved in the full CSV. Source file: wine.data; retrieved 2026-09-08; empty or question-mark cells found in this file: 0. Download the original archive from UCI.
6be6b1203f3d51df0b553a70e57b8a723cd405683958204f96d23d7cd6aea659
The downloadable provenance JSON records the checksum and every selected source row. The source archive includes the refresh script and pinned data, so normal builds do not depend on a live upstream download.
Resource and chart by SupaMakers; original data authors credited above. Explore all public datasets →