What the columns mean
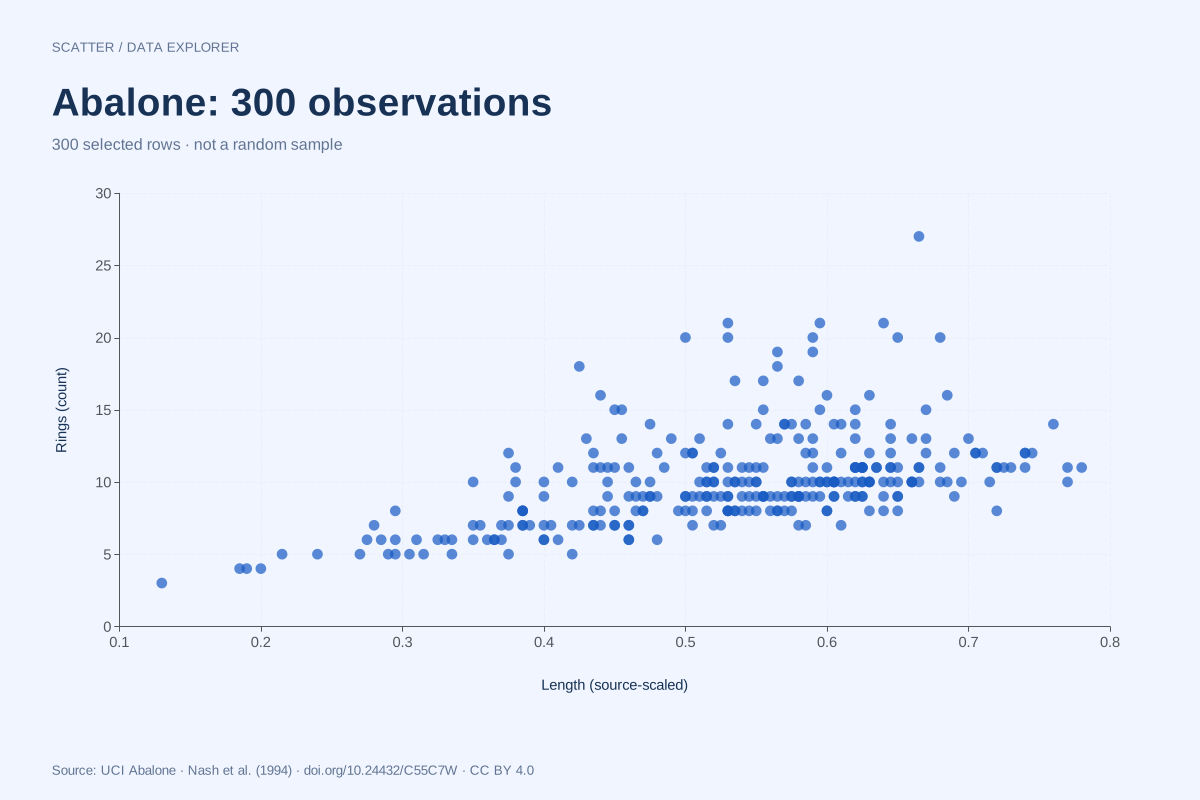
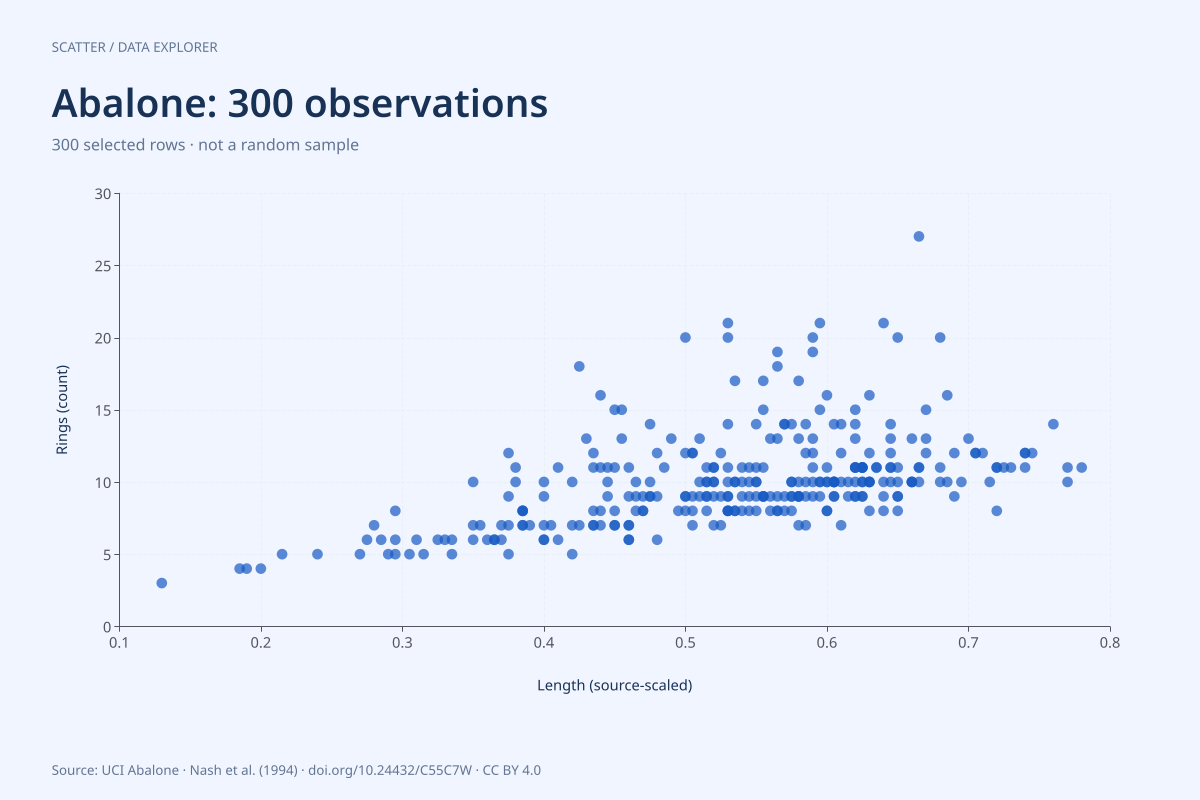
The source contains a sex/category field, seven continuous physical measurements and ring count. UCI documents prior removal of missing records and scaling of continuous values by division by 200. We preserve the supplied numeric values and label length as source-scaled rather than presenting it as an untransformed millimetre measurement.
What this chart helps you inspect
The chart selects source rows floor(i × 4176 / 299) + 1 for i from 0 to 299. This includes the first and last rows and spaces selected positions across the file. It is deterministic and reproducible, but it is not random sampling and carries no representativeness guarantee. The manifest lists every selected one-based row number.
Limits of this resource
The complete CSV exceeds this editor’s 2,000-observation limit. Use the 300-row file for this chart or analyze the complete data in another environment. Ring count remains ring count; this chart does not relabel it as exact age. The subset cannot establish population relationships, and the source’s earlier preprocessing is separate from our conversion.
Calculated from the plotted rows
| Variable | N | Minimum | Maximum | Mean |
|---|---|---|---|---|
| length | 300 | 0.13 | 0.78 | 0.532367 |
| rings | 300 | 3 | 27 | 10.1367 |
These descriptive values are computed from the chart CSV at build time. Displayed means use up to six significant digits; downloaded measurements retain their original precision. They summarize the plotted selection only and are not population estimates. No rows are removed during chart preparation beyond the explicit selection rule above.
Preview of the full CSV
The first eight source rows are shown here; the download contains the complete 4,177-row file with a header.
| sex | length | diameter | height | whole_weight | shucked_weight | viscera_weight | shell_weight | rings |
|---|---|---|---|---|---|---|---|---|
| M | 0.455 | 0.365 | 0.095 | 0.514 | 0.2245 | 0.101 | 0.15 | 15 |
| M | 0.35 | 0.265 | 0.09 | 0.2255 | 0.0995 | 0.0485 | 0.07 | 7 |
| F | 0.53 | 0.42 | 0.135 | 0.677 | 0.2565 | 0.1415 | 0.21 | 9 |
| M | 0.44 | 0.365 | 0.125 | 0.516 | 0.2155 | 0.114 | 0.155 | 10 |
| I | 0.33 | 0.255 | 0.08 | 0.205 | 0.0895 | 0.0395 | 0.055 | 7 |
| I | 0.425 | 0.3 | 0.095 | 0.3515 | 0.141 | 0.0775 | 0.12 | 8 |
| F | 0.53 | 0.415 | 0.15 | 0.7775 | 0.237 | 0.1415 | 0.33 | 20 |
| F | 0.545 | 0.425 | 0.125 | 0.768 | 0.294 | 0.1495 | 0.26 | 16 |
Source, version and reuse
W. Nash, T. Sellers, S. Talbot, A. Cawthorn and W. Ford (1994). Abalone [Dataset]. UCI Machine Learning Repository. 10.24432/C55C7W. Licensed CC BY 4.0. Retain attribution and identify changes when reusing.
ChartsAI adds column headers and CSV formatting, selects the declared chart columns and rows, and generates the visual and summaries. Original numeric strings are preserved in the full CSV. Source file: abalone.data; retrieved 2026-09-08; empty or question-mark cells found in this file: 0. Download the original archive from UCI.
de37cdcdcaaa50c309d514f248f7c2302a5f1f88c168905eba23fe2fbc78449f
The downloadable provenance JSON records the checksum and every selected source row. The source archive includes the refresh script and pinned data, so normal builds do not depend on a live upstream download.
Resource and chart by SupaMakers; original data authors credited above. Explore all public datasets →