What the columns mean
The first column is a record identifier and the last a glass-type code. Sodium and the other elemental fields are reported as weight percent in the corresponding oxide; refractive index is a separate dimensionless measure. The repository lists class code 4 but notes that no observations of that class are present.
What this chart helps you inspect
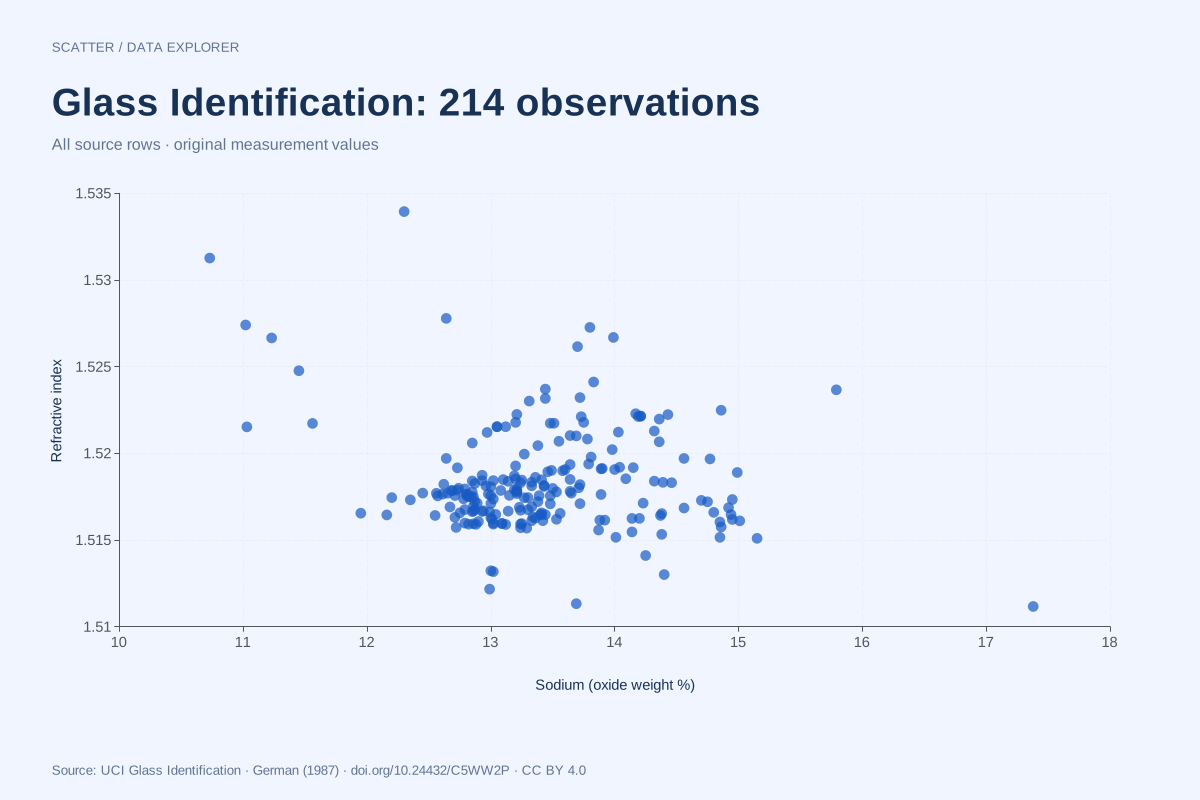
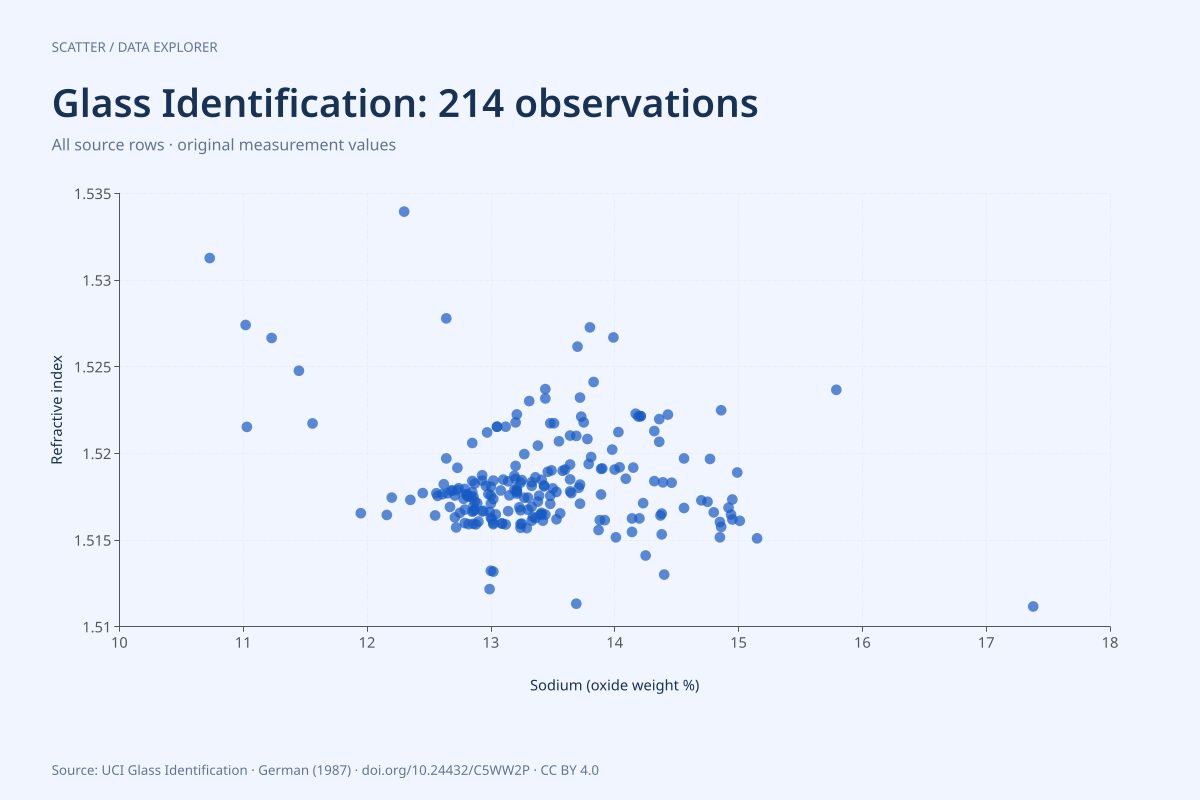
The record identifier is retained for traceability and excluded from the scatter coordinates. Sodium supplies X and refractive index supplies Y. These different measures belong on separately labelled axes; they should not be summed as though they were parts of a common total. The chart retains unusual measurements rather than deleting them to produce a smoother cloud.
Limits of this resource
This historical dataset supports exploratory plotting and method practice. A scatter of two measurements is not a validated identification procedure or forensic conclusion. Class membership and the remaining measurements are available in the full CSV for more careful analysis, but no classifier is trained here.
Calculated from the plotted rows
| Variable | N | Minimum | Maximum | Mean |
|---|---|---|---|---|
| sodium | 214 | 10.73 | 17.38 | 13.4079 |
| refractive_index | 214 | 1.51115 | 1.53393 | 1.51837 |
These descriptive values are computed from the chart CSV at build time. Displayed means use up to six significant digits; downloaded measurements retain their original precision. They summarize the plotted selection only and are not population estimates. No rows are removed during chart preparation beyond the explicit selection rule above.
Preview of the full CSV
The first eight source rows are shown here; the download contains the complete 214-row file with a header.
| id | refractive_index | sodium | magnesium | aluminum | silicon | potassium | calcium | barium | iron | class |
|---|---|---|---|---|---|---|---|---|---|---|
| 1 | 1.52101 | 13.64 | 4.49 | 1.10 | 71.78 | 0.06 | 8.75 | 0.00 | 0.00 | 1 |
| 2 | 1.51761 | 13.89 | 3.60 | 1.36 | 72.73 | 0.48 | 7.83 | 0.00 | 0.00 | 1 |
| 3 | 1.51618 | 13.53 | 3.55 | 1.54 | 72.99 | 0.39 | 7.78 | 0.00 | 0.00 | 1 |
| 4 | 1.51766 | 13.21 | 3.69 | 1.29 | 72.61 | 0.57 | 8.22 | 0.00 | 0.00 | 1 |
| 5 | 1.51742 | 13.27 | 3.62 | 1.24 | 73.08 | 0.55 | 8.07 | 0.00 | 0.00 | 1 |
| 6 | 1.51596 | 12.79 | 3.61 | 1.62 | 72.97 | 0.64 | 8.07 | 0.00 | 0.26 | 1 |
| 7 | 1.51743 | 13.30 | 3.60 | 1.14 | 73.09 | 0.58 | 8.17 | 0.00 | 0.00 | 1 |
| 8 | 1.51756 | 13.15 | 3.61 | 1.05 | 73.24 | 0.57 | 8.24 | 0.00 | 0.00 | 1 |
Source, version and reuse
B. German (1987). Glass Identification [Dataset]. UCI Machine Learning Repository. 10.24432/C5WW2P. Licensed CC BY 4.0. Retain attribution and identify changes when reusing.
ChartsAI adds column headers and CSV formatting, selects the declared chart columns and rows, and generates the visual and summaries. Original numeric strings are preserved in the full CSV. Source file: glass.data; retrieved 2026-09-08; empty or question-mark cells found in this file: 0. Download the original archive from UCI.
dd67373f4baf2807345df02cbfef2093d342e61ad0d82a4fb79af43ef8ce449d
The downloadable provenance JSON records the checksum and every selected source row. The source archive includes the refresh script and pinned data, so normal builds do not depend on a live upstream download.
Resource and chart by SupaMakers; original data authors credited above. Explore all public datasets →