Does the pooled pattern hide species differences?
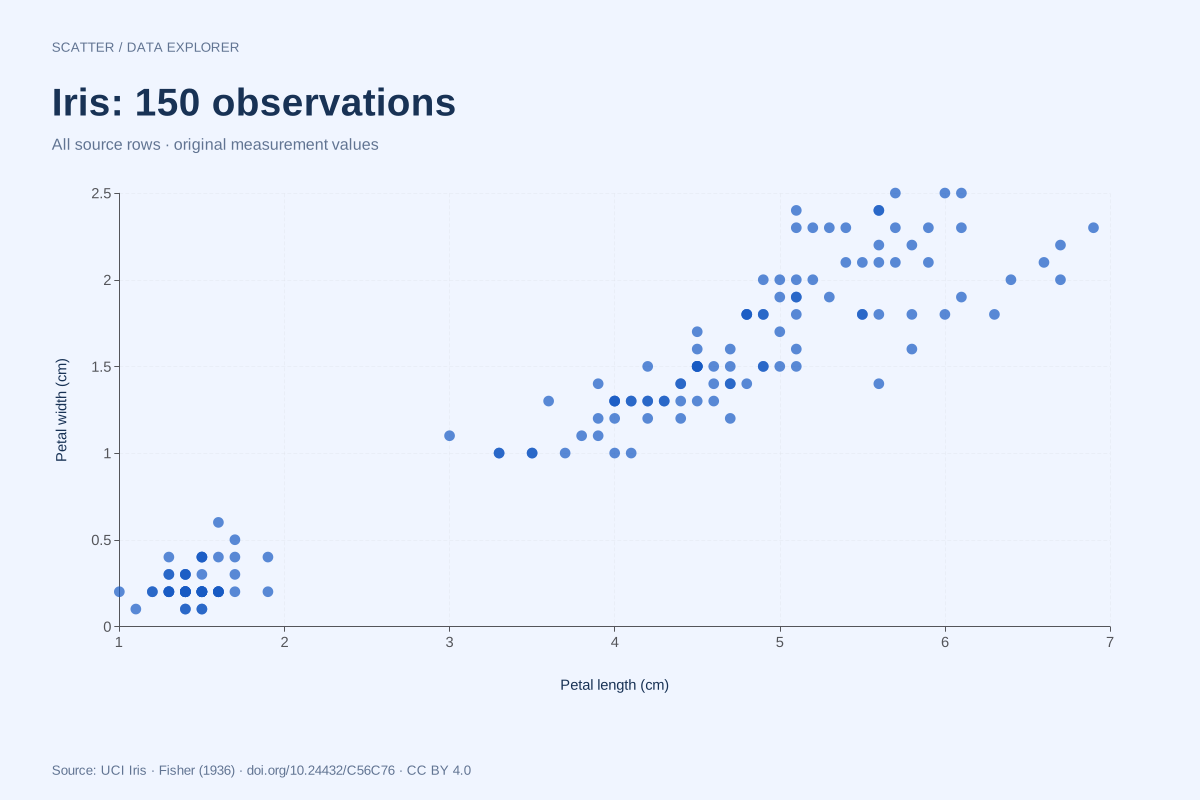
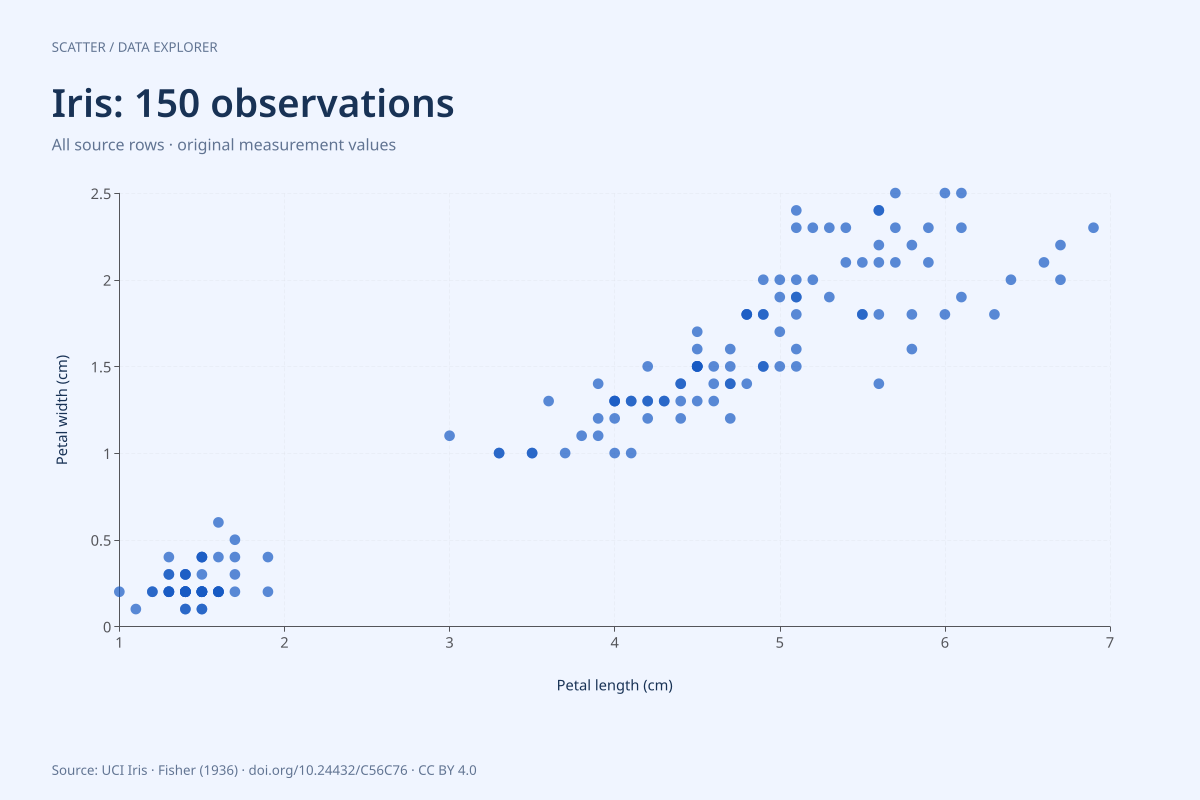
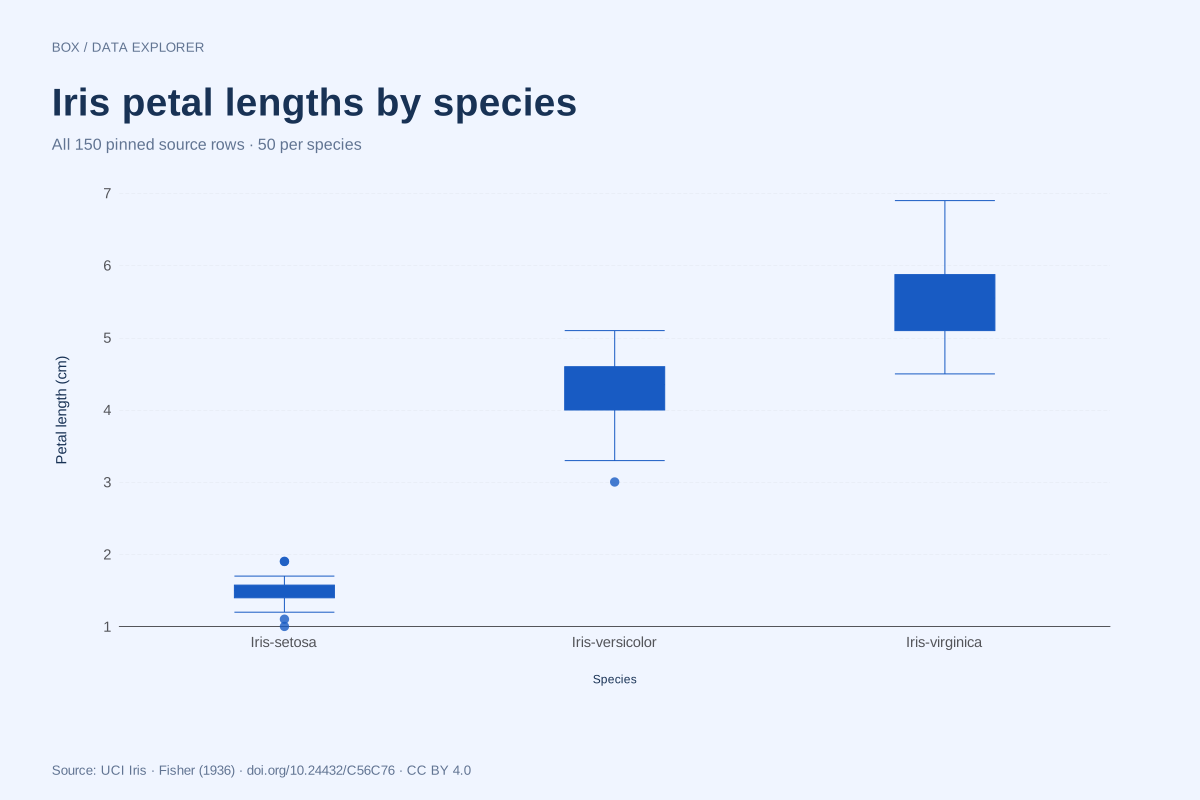
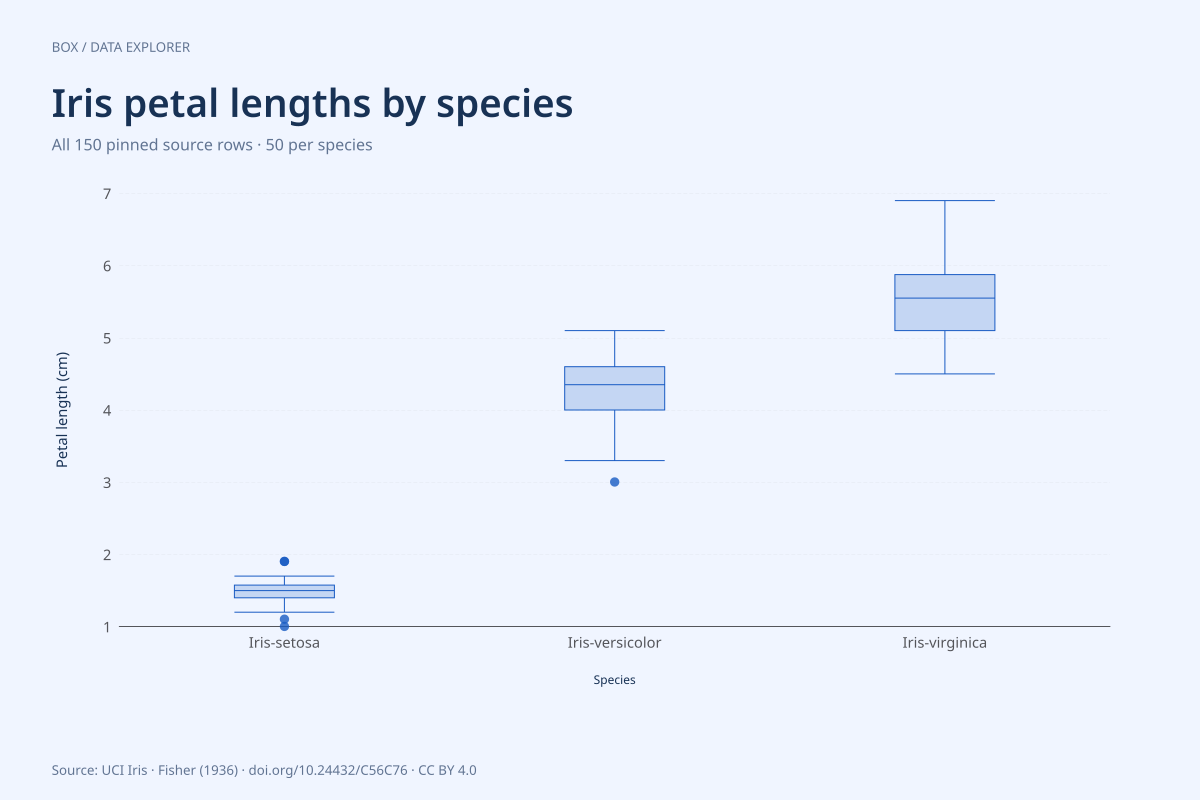
The scatter above mixes all three species. Compare petal-length distributions using the same 150 source rows: 50 observations per group. The group summaries describe this historical sample; they do not demonstrate a classifier’s accuracy or a causal effect.
| Species | N | Q1 (cm) | Median (cm) | Q3 (cm) | Flagged observations |
|---|---|---|---|---|---|
| Iris-setosa | 50 | 1.4 | 1.5 | 1.5750000000000002 | 4 |
| Iris-versicolor | 50 | 4 | 4.35 | 4.6 | 1 |
| Iris-virginica | 50 | 5.1 | 5.55 | 5.875 | 0 |
Quartiles use linear interpolation at (N − 1)p. Whiskers end at the outermost observed values within 1.5 IQR; points beyond them stay visible. No rows are removed. Compare the medians and spread alongside the raw group CSV; different summaries do not establish population differences. See what a box plot leaves out.
What the columns mean
Four measurements describe sepal length, sepal width, petal length and petal width in centimetres. The final column identifies species. The repository includes both iris.data and bezdekIris.data and documents differences from Fisher’s published records; this resource consistently uses bezdekIris.data.
What this chart helps you inspect
The plotted pair is petal length and petal width, retaining every row and the original numeric values. A pooled scatter can show association across the sample, but species membership may contribute to that pattern. Use the full CSV to compare species separately before describing a within-species relationship. Exactly overlapping points remain separate observations in the download.
Limits of this resource
This historical teaching dataset is not a random sample of all irises. It does not establish current population proportions or a causal effect of one petal measurement on another. Our chart uses one colour for all observations, so it should not be mistaken for a species classifier.
Calculated from the plotted rows
| Variable | N | Minimum | Maximum | Mean |
|---|---|---|---|---|
| petal_length | 150 | 1 | 6.9 | 3.758 |
| petal_width | 150 | 0.1 | 2.5 | 1.19933 |
These descriptive values are computed from the chart CSV at build time. Displayed means use up to six significant digits; downloaded measurements retain their original precision. They summarize the plotted selection only and are not population estimates. No rows are removed during chart preparation beyond the explicit selection rule above.
Preview of the full CSV
The first eight source rows are shown here; the download contains the complete 150-row file with a header.
| sepal_length | sepal_width | petal_length | petal_width | species |
|---|---|---|---|---|
| 5.1 | 3.5 | 1.4 | 0.2 | Iris-setosa |
| 4.9 | 3.0 | 1.4 | 0.2 | Iris-setosa |
| 4.7 | 3.2 | 1.3 | 0.2 | Iris-setosa |
| 4.6 | 3.1 | 1.5 | 0.2 | Iris-setosa |
| 5.0 | 3.6 | 1.4 | 0.2 | Iris-setosa |
| 5.4 | 3.9 | 1.7 | 0.4 | Iris-setosa |
| 4.6 | 3.4 | 1.4 | 0.3 | Iris-setosa |
| 5.0 | 3.4 | 1.5 | 0.2 | Iris-setosa |
Source, version and reuse
R. A. Fisher (1936). Iris [Dataset]. UCI Machine Learning Repository. 10.24432/C56C76. Licensed CC BY 4.0. Retain attribution and identify changes when reusing.
ChartsAI adds column headers and CSV formatting, selects the declared chart columns and rows, and generates the visual and summaries. Original numeric strings are preserved in the full CSV. Source file: bezdekIris.data; retrieved 2026-09-08; empty or question-mark cells found in this file: 0. Download the original archive from UCI.
0fed2a99db77ec533a62dc66894d3ec6df3b58b6a8f3cf4a6b47e4086b7f97dc
The downloadable provenance JSON records the checksum and every selected source row. The source archive includes the refresh script and pinned data, so normal builds do not depend on a live upstream download.
Resource and chart by SupaMakers; original data authors credited above. Explore all public datasets →