What the columns mean
The source has seven geometric features and a final class code. Features are area, perimeter, compactness, kernel length, kernel width, asymmetry coefficient and groove length. The repository describes three wheat varieties with seventy observations each. Units are not specified in its variable listing, so the chart labels retain the source scale.
What this chart helps you inspect
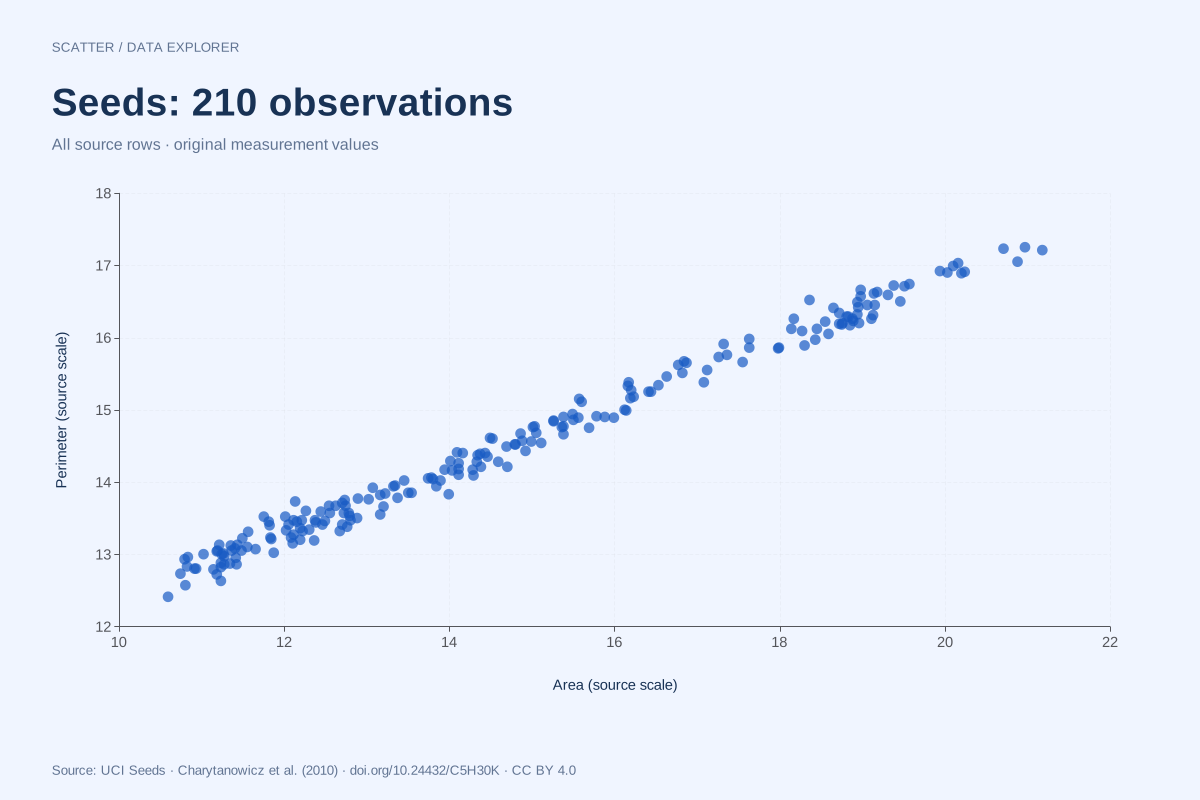
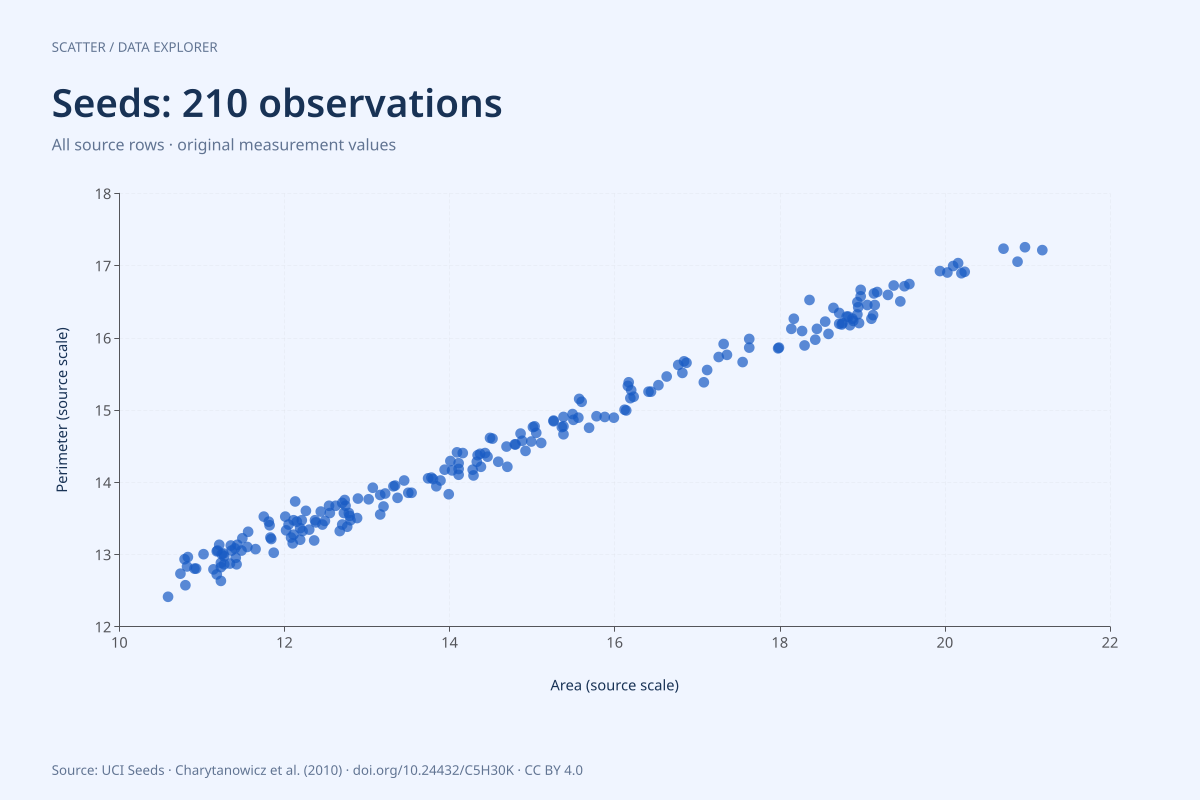
Area and perimeter describe related aspects of kernel geometry. Their scatter is useful for examining the sample’s shape relationship, but the two measurements are not interchangeable. The compactness feature uses 4πA/P², which already combines area and perimeter. A follow-up analysis should recognize that mathematical dependence before treating all three fields as independent evidence.
Limits of this resource
The plotted sample describes the supplied experimental kernels. It is not a production yield comparison or evidence of a superior variety. The chart does not infer a variety name from the class code; use the primary documentation when assigning category labels in a downstream analysis.
Calculated from the plotted rows
| Variable | N | Minimum | Maximum | Mean |
|---|---|---|---|---|
| area | 210 | 10.59 | 21.18 | 14.8475 |
| perimeter | 210 | 12.41 | 17.25 | 14.5593 |
These descriptive values are computed from the chart CSV at build time. Displayed means use up to six significant digits; downloaded measurements retain their original precision. They summarize the plotted selection only and are not population estimates. No rows are removed during chart preparation beyond the explicit selection rule above.
Preview of the full CSV
The first eight source rows are shown here; the download contains the complete 210-row file with a header.
| area | perimeter | compactness | kernel_length | kernel_width | asymmetry | groove_length | class |
|---|---|---|---|---|---|---|---|
| 15.26 | 14.84 | 0.871 | 5.763 | 3.312 | 2.221 | 5.22 | 1 |
| 14.88 | 14.57 | 0.8811 | 5.554 | 3.333 | 1.018 | 4.956 | 1 |
| 14.29 | 14.09 | 0.905 | 5.291 | 3.337 | 2.699 | 4.825 | 1 |
| 13.84 | 13.94 | 0.8955 | 5.324 | 3.379 | 2.259 | 4.805 | 1 |
| 16.14 | 14.99 | 0.9034 | 5.658 | 3.562 | 1.355 | 5.175 | 1 |
| 14.38 | 14.21 | 0.8951 | 5.386 | 3.312 | 2.462 | 4.956 | 1 |
| 14.69 | 14.49 | 0.8799 | 5.563 | 3.259 | 3.586 | 5.219 | 1 |
| 14.11 | 14.1 | 0.8911 | 5.42 | 3.302 | 2.7 | 5 | 1 |
Source, version and reuse
M. Charytanowicz, J. Niewczas, P. Kulczycki, P. Kowalski and S. Lukasik (2010). Seeds [Dataset]. UCI Machine Learning Repository. 10.24432/C5H30K. Licensed CC BY 4.0. Retain attribution and identify changes when reusing.
ChartsAI adds column headers and CSV formatting, selects the declared chart columns and rows, and generates the visual and summaries. Original numeric strings are preserved in the full CSV. Source file: seeds_dataset.txt; retrieved 2026-09-08; empty or question-mark cells found in this file: 0. Download the original archive from UCI.
1f3f83c0d8485ae9148061389d19628607e3f5660e3d6f40ec9102fb398bb12f
The downloadable provenance JSON records the checksum and every selected source row. The source archive includes the refresh script and pinned data, so normal builds do not depend on a live upstream download.
Resource and chart by SupaMakers; original data authors credited above. Explore all public datasets →