How to read this chart
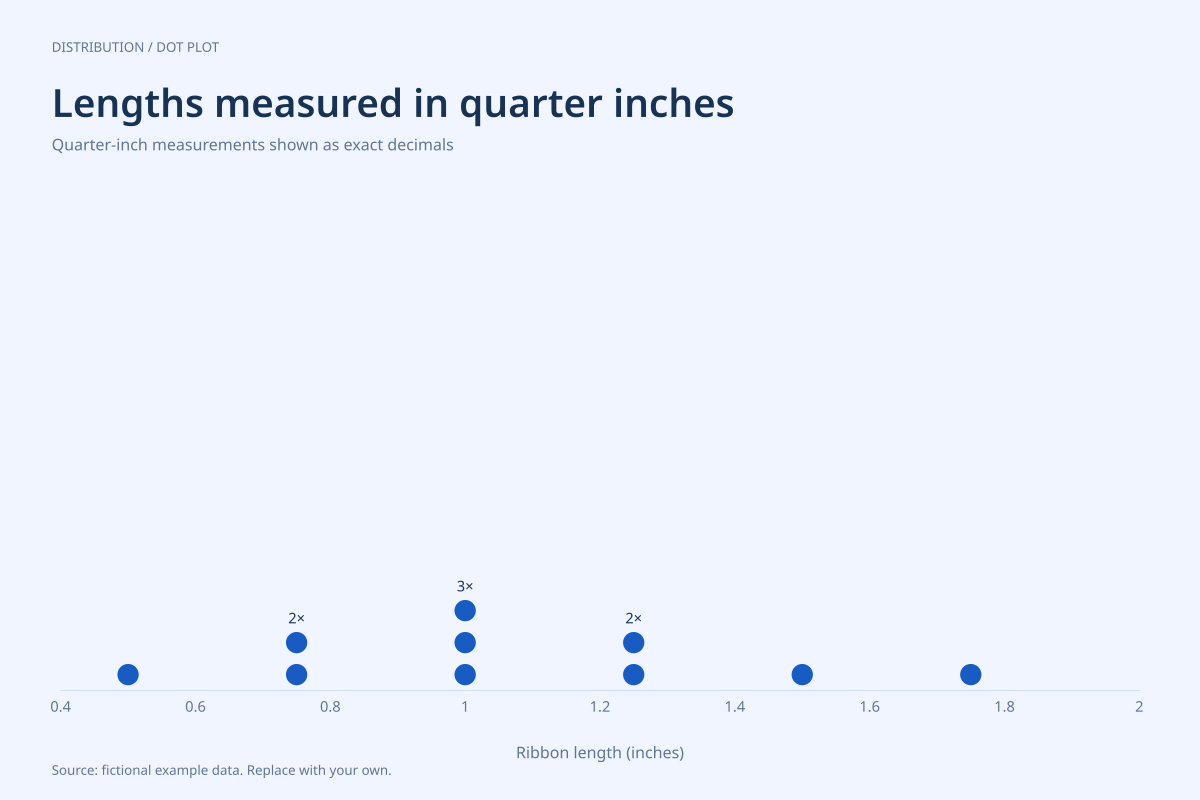
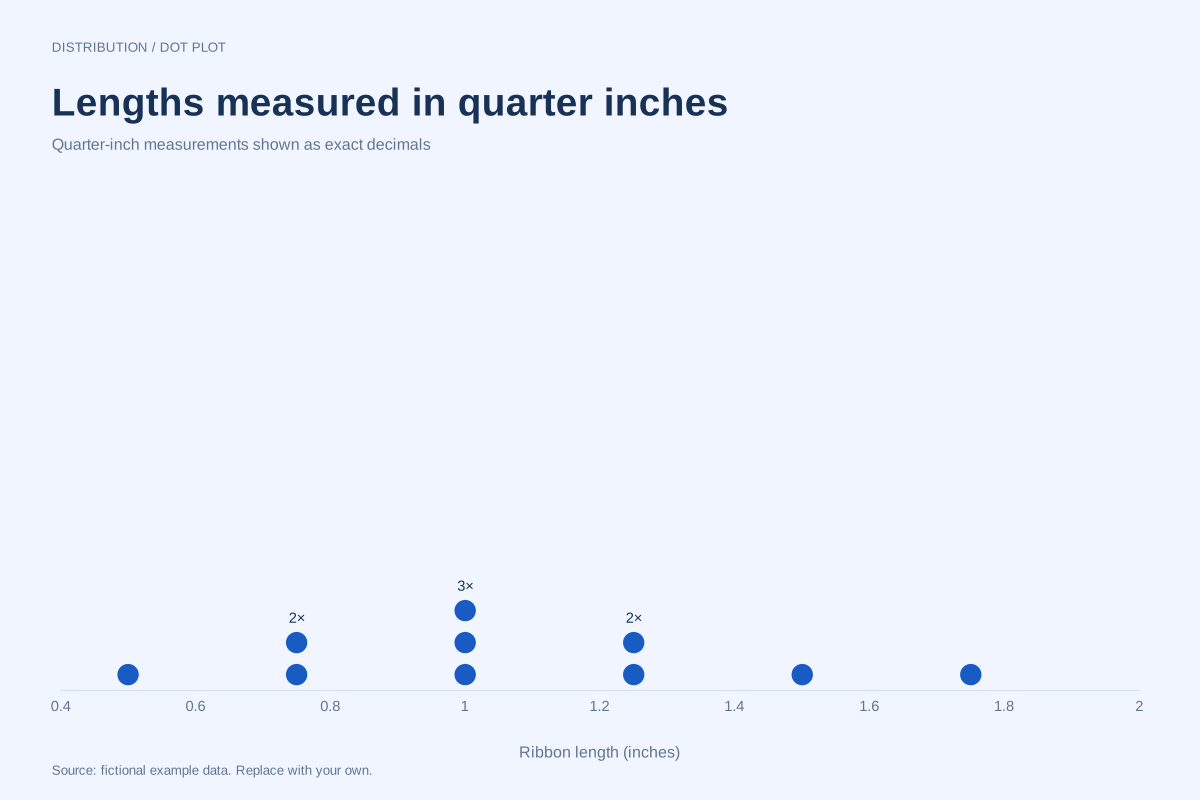
The ten lengths are 0.5, 0.75, 0.75, 1, 1, 1, 1.25, 1.25, 1.5 and 1.75 inches. Three ribbons are exactly one inch long. Four ribbons measure at least 1.25 inches: two at 1.25, one at 1.5 and one at 1.75.
The total length is 10.75 inches, or 10¾ inches. The middle two observations are both 1 inch, so the median length is 1 inch. The difference between the longest and shortest ribbons is 1.75 − 0.5 = 1.25 inches.
Build it with your own data
Convert these quarter fractions before entering numeric data: ½ = 0.5, ¾ = 0.75, 1¼ = 1.25, 1½ = 1.5 and 1¾ = 1.75. These particular fractions have exact finite decimal equivalents, so the conversion does not round their values.
Use one row for each physical ribbon, including duplicates. Keep inches as the unit throughout. For a classroom activity, download the chart alongside the data and ask readers to translate axis decimals back into fractions before comparing or adding lengths.
Open this example in the dot plot maker Replace the data, inspect the preview and download your version. SVG, PNG and PDF exports are available in the editor.
What this example cannot tell you
This example supports fraction reasoning through decimal coordinates. It does not provide a fraction-entry parser or a custom fraction-labelled axis. Repeating fractions such as one third require an explicit precision decision and do not behave like the quarter fractions used here.
Can I type 1/4 directly as a numeric observation?
Use 0.25 for one quarter in this editor. A slash fraction is not the same input as a decimal number. Convert deliberately, preserve the measurement unit, and inspect the import preview before using the resulting plot.
Created and reviewed by SupaMakers for ChartsAI · September 8, 2026. Source code and reuse terms.