How to read this chart
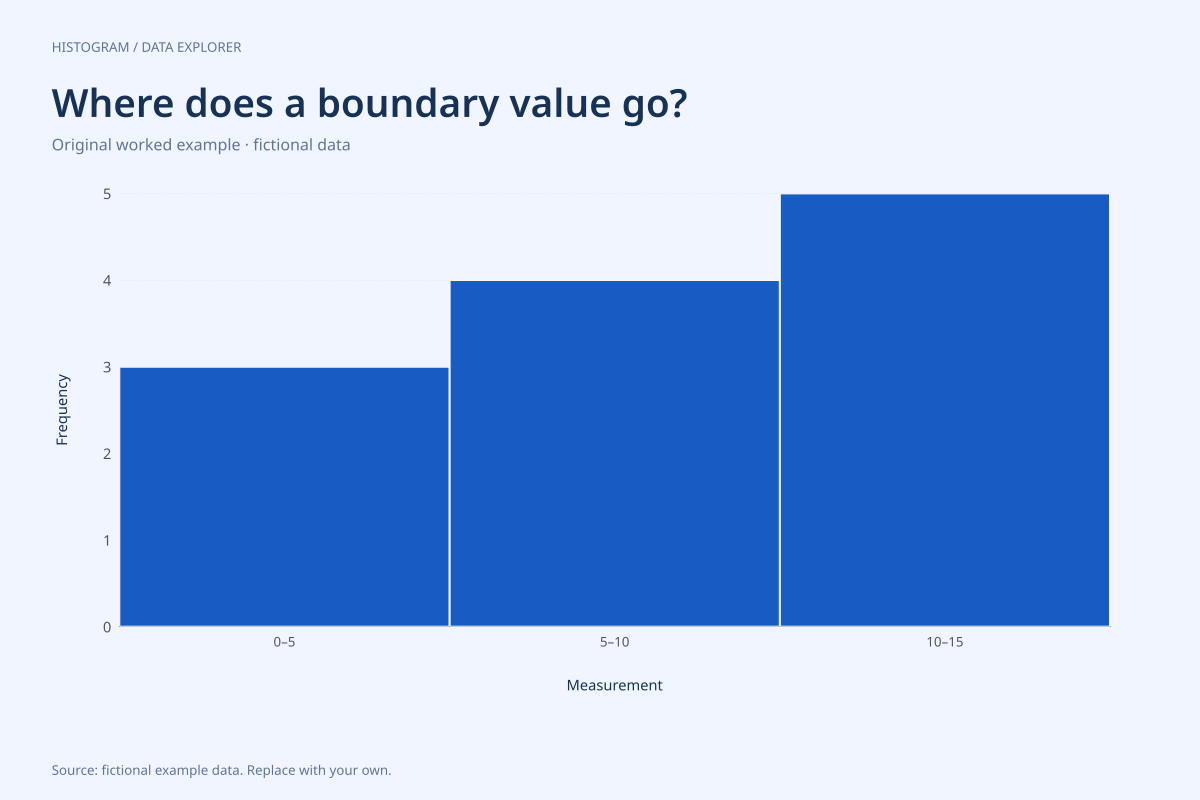
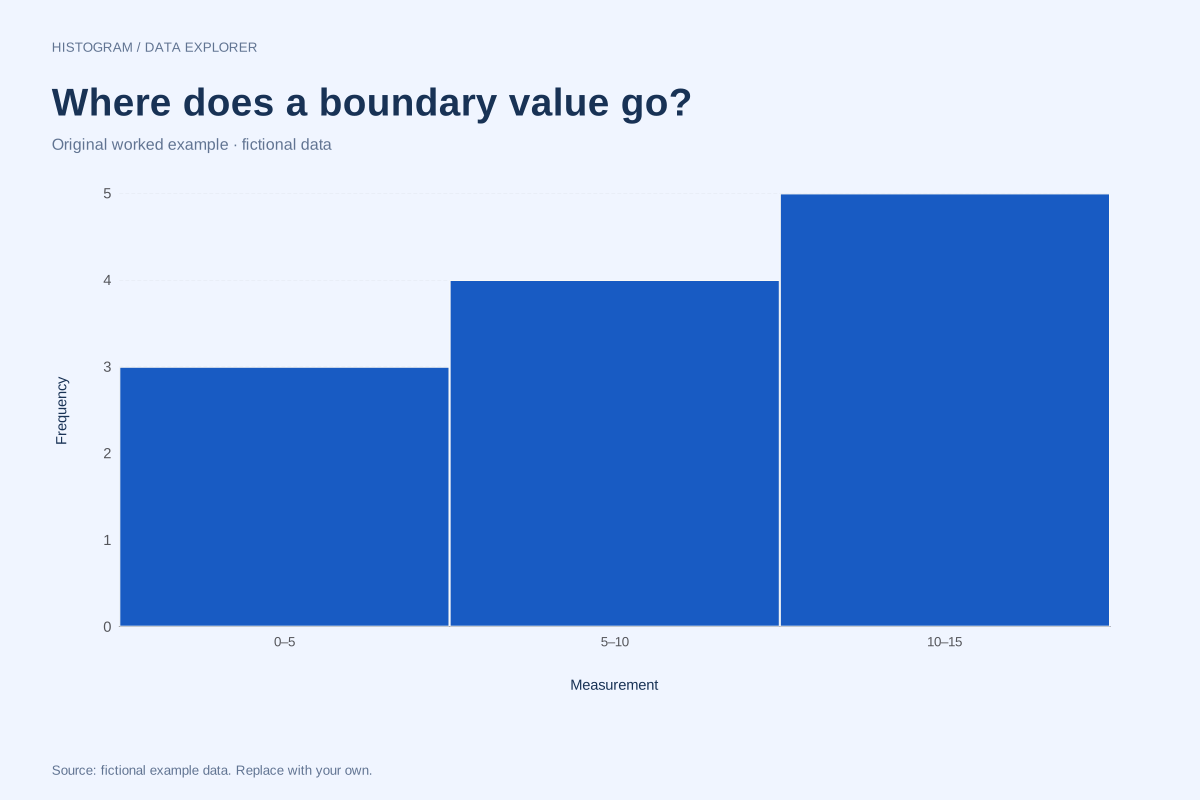
With start 0 and width 5, the intervals are [0, 5), [5, 10) and [10, 15]. Their counts are 3, 4 and 5. The notation [ includes the endpoint, while ) excludes it. Only the last interval closes on both sides.
The values 5 and 5 belong to the second interval. The values 10 and 10 belong to the third. The maximum, 15, also belongs to the third because the final upper boundary is inclusive. Assigning endpoints to both adjacent bins would inflate the total.
Try the calculation yourself
Download the CSV and tally the intervals by hand before changing any setting. Then move the start below zero while keeping width 5. The bin alignment changes, and the new counts must still sum to twelve. Check both the range and closure rule when reproducing this chart in another program.
Open this exact example, change the data or calculation settings, and compare the result. The CSV preserves the input rows; the ECharts JSON contains drawing options.
What this example cannot tell you
These are designed boundary cases, not measured frequencies from a population. Other software can use right-closed bins, producing different counts without either calculation being inherently wrong.
Why might another histogram put 5 in the first bin?
It may use intervals open on the left and closed on the right. Compare the stated rules before comparing results. In this maker interior intervals include their lower boundary and exclude their upper boundary, so 5 starts the second interval.
Calculation convention
A histogram counts individual observations inside numeric intervals. Use the bin-count control for an initial equal-width partition, or enter a start and width for boundaries you can explain. Entering a width overrides the count. The chart supports at most 50 bins; it asks you to increase width when the requested range would exceed that limit.
Method background: NIST: histogram definitions and uses.
Created by SupaMakers for ChartsAI · September 8, 2026. Source and reuse terms.