How to read this chart
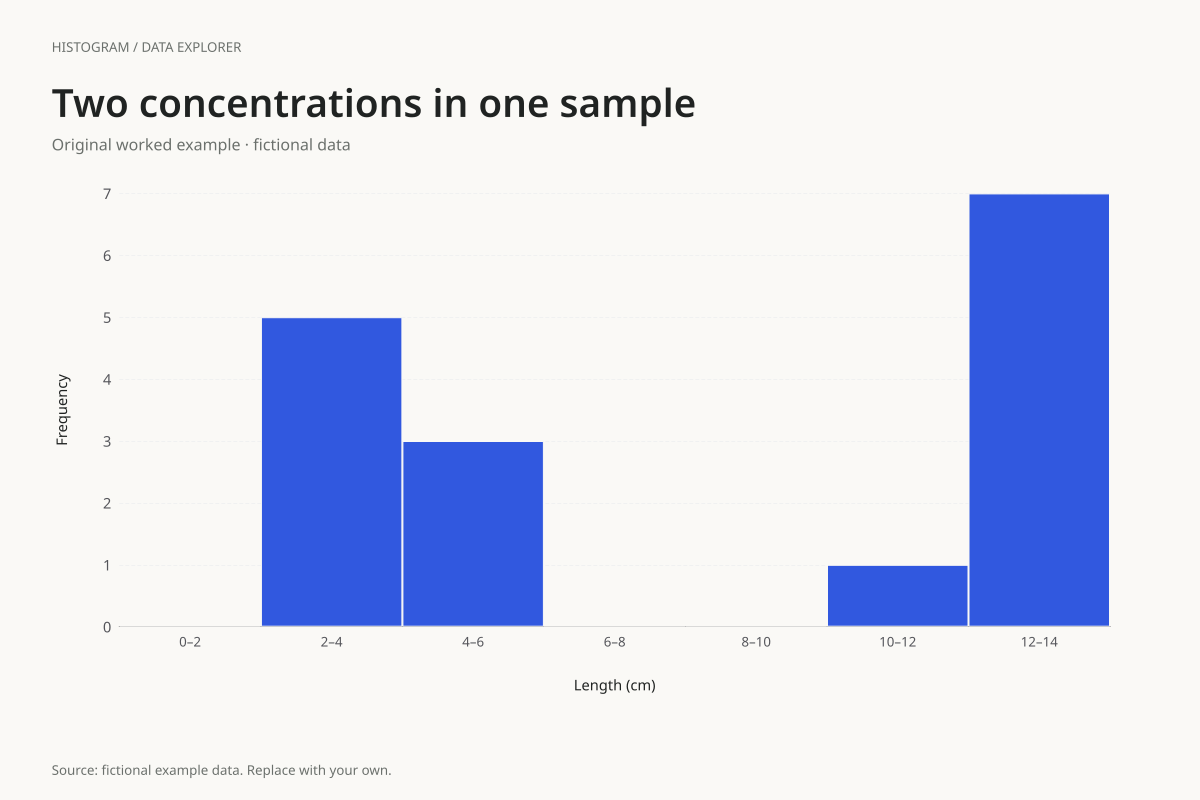
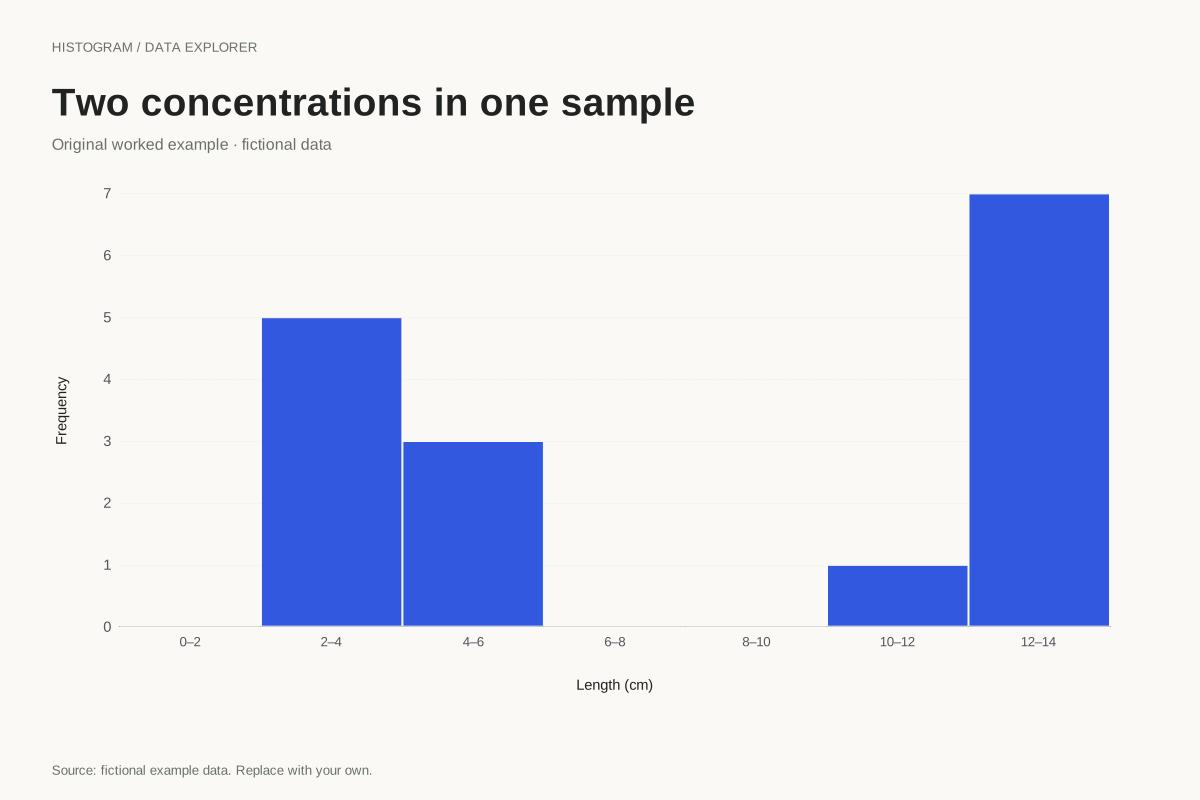
With a start of zero and width of two, the bins contain 0, 5, 3, 0, 0, 1 and 7 observations. The last interval includes its upper boundary, so the two observations at 14 cm remain in the final bar. The total count is sixteen.
The empty 6–under 8 and 8–under 10 intervals show a gap between the clusters. A category chart made only from occupied intervals would close that gap and change the apparent shape. The full sequence of numeric bins is part of the information.
Try the calculation yourself
Try a width of four to see how neighbouring intervals combine. Then inspect the original data before deciding whether there are two meaningful groups. A real explanation might depend on measurement conditions or sample membership, which this one-column dataset does not provide.
Open this exact example, change the data or calculation settings, and compare the result. The CSV preserves the input rows; the ECharts JSON contains drawing options.
What this example cannot tell you
The two concentrations were designed for teaching. Their appearance does not prove two populations or a mixture model. Histogram peaks depend partly on bin alignment, and the exact observed modes are not the same thing as the tallest intervals.
Can a histogram hide two clusters?
Yes. Wide bins can combine observations across a gap and make distinct concentrations look like one broad group. Test plausible widths while keeping the underlying observations unchanged, and report the grouping used in the published chart.
Calculation convention
A histogram counts individual observations inside numeric intervals. Use the bin-count control for an initial equal-width partition, or enter a start and width for boundaries you can explain. Entering a width overrides the count. The chart supports at most 50 bins; it asks you to increase width when the requested range would exceed that limit.
Method background: NIST: histogram definitions and uses.
Created by SupaMakers for ChartsAI · September 8, 2026. Source and reuse terms.