Slope calculator.

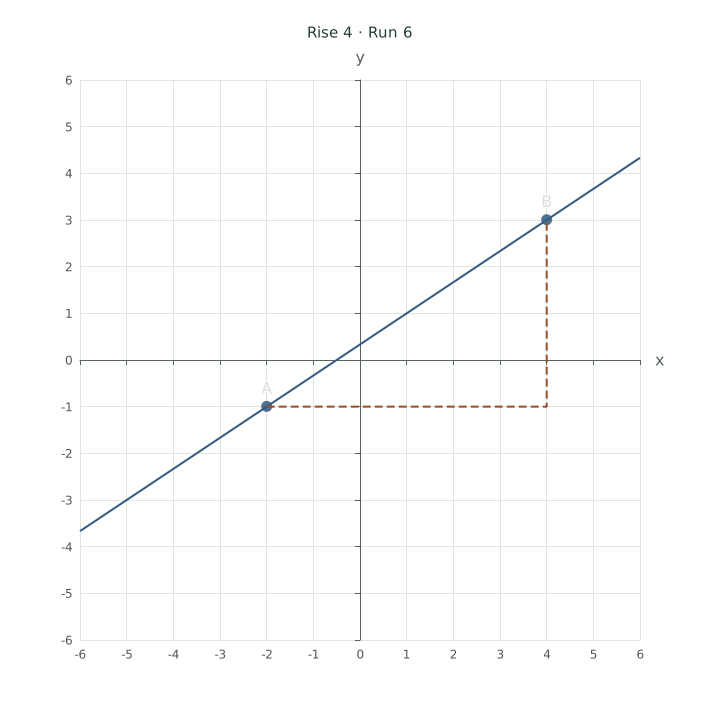
Enter two points to calculate slope as change in y divided by change in x. The graph shows the line and a dashed rise-and-run path, while the worked solution gives the arithmetic and equation. Switch to practice to find the answers yourself.

EXPLORE · PRACTISE · PRINTFree · No signup · Stays on your device

2 See how it works

Loading controls…

A (-2, -1), B (4, 3)

y x -6 -5 -4 -3 -2 -1 0 1 2 3 4 5 6 -6 -5 -4 -3 -2 -1 0 1 2 3 4 5 6 A B Rise 4 · Run 6

Step by step

Rise = 3 − (-1) = 4

Run = 4 − (-2) = 6

Slope = 4 ÷ (6) = 2/3

y = 2/3x + 1/3

Values used in this example
PointXY
A-2-1
B43

Equal X/Y units. The line extends across the displayed window; the dashed right-angle path shows rise and run. Coordinates −50 to 50; decimals and fractions supported.

3 Download & use it

PDF includes the problem and space to work. Practice mode can add a separate answer key; Explore mode gives a worked page.

SVG and PNG match the diagram currently shown. CSV includes calculated values, even in practice mode.

Practice PDF page 1 keeps the answers hidden, even after revealing them on screen. PDF pages use high-resolution images.

How to use it

  1. Enter X and Y for point A and point B. Fractions such as 1/2 are accepted. Choose a preset for positive, negative, horizontal or vertical slope.
  2. Follow the dashed path from A across to the X position of B, then vertically to B. Read the signed rise and run together.
  3. Move point B with the slider to explore, or switch to Practice mode. Download the graph or print a worksheet with an optional answer key.

Rise four. Run six. Slope two-thirds.

A is (−2, −1) and B is (4, 3). The vertical change is 3 − (−1) = 4. The horizontal change is 4 − (−2) = 6. Therefore the slope is 4/6 = 2/3.

Substitute A into y = mx + b: −1 = (2/3)(−2) + b, so b = 1/3. The equation is y = (2/3)x + 1/3. Both given points lie on that line. Reversing A and B changes both signs and leaves the slope unchanged.

Free for class, homework and presentations. Two-page PDFs: question first, answer key second. Print in portrait at 100% / Actual size.

Rise four. Run six. Slope two-thirds.

Understand the result

Keep the subtraction order consistent

For A (x₁, y₁) and B (x₂, y₂), use m = (y₂ − y₁)/(x₂ − x₁). Positive slope rises as you move right; negative slope falls. You can work from B to A instead, provided you reverse both subtractions. Reversing only one gives the wrong sign.

Horizontal, vertical and repeated points

A horizontal line has rise zero and nonzero run, so its slope is zero. A vertical line has run zero and nonzero rise: its slope is undefined and its equation is x = a constant. Two identical points determine no unique line, so the calculator asks you to change a point.

What the graph and exports show

Both axes use the same unit scale, and the window includes the two points. The infinite mathematical line is clipped to that window. Inputs must be between −50 and 50. The slider offers half-unit steps from −10 to 10; the text fields allow other supported values. The CSV contains the original two points, and PDF includes the calculation in Explore mode or a question sheet in Practice mode.

Further reference: Calculator.net: slope formula and special cases. Examples, tool design and practice sheets on this page are original ChartsAI work; no affiliation is implied.

Common questions

Is gradient the same as slope?

For a straight line in this tool, yes. Both mean the signed change in y divided by the signed change in x. This is a coordinate calculation, not a roof-pitch or land-survey tool.

Why is the slope undefined?

Your points have the same X coordinate and different Y coordinates. The run is zero, so the slope formula would divide by zero. The calculator shows the vertical line equation instead.

Does the CSV contain generated observations?

No. It contains the two points you entered. The line and rise/run path are calculated constructions, not extra measured data.

Another way to see the maths.

Number line generator

For locating numbers, explaining addition and subtraction, and learning interval notation.

Quadratic graph calculator

For learning how a quadratic equation, its key features and a plotted parabola describe the same function.

Start with coordinate-plane plotting practice, or browse all free math tools.