Four-quadrant grid
A blank plane from −10 to 10 on both axes, numbered in ones. Space for a name and date.
A4 PDF ↓ · Letter PDF ↓This free coordinate plane generator makes blank grids, labelled point diagrams and practice worksheets. Choose one or four quadrants, add your points, then download a graph or a printable PDF with an optional answer key.
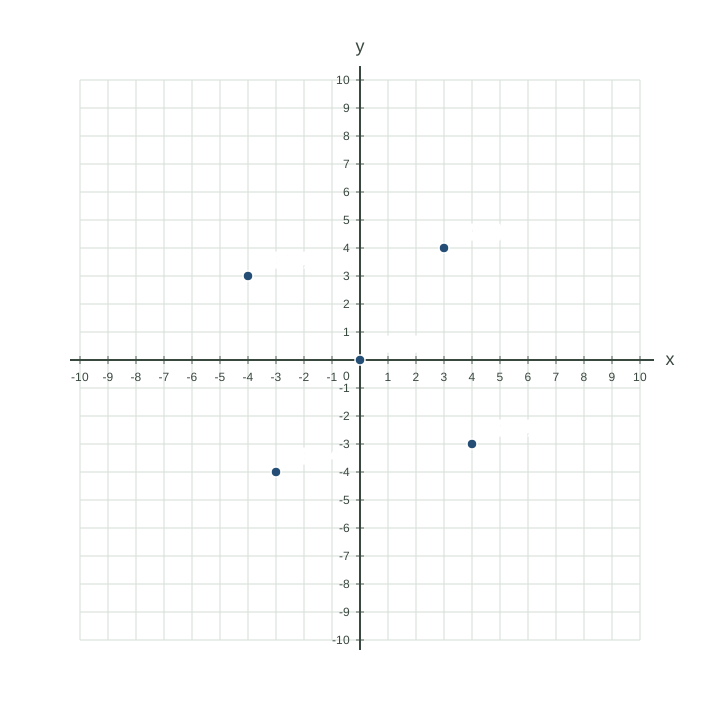
| Point | X | Y | Position |
|---|---|---|---|
| A | 3 | 4 | Quadrant I |
| B | -4 | 3 | Quadrant II |
| C | -3 | -4 | Quadrant III |
| D | 4 | -3 | Quadrant IV |
| O | 0 | 0 | Origin |
PDF is a complete page. SVG and PNG contain the graph currently shown. CSV always includes all point values.
Portrait · Print at 100%. Practice PDFs keep answers off page 1, even after revealing them on screen.
A blank plane from −10 to 10 on both axes, numbered in ones. Space for a name and date.
A4 PDF ↓ · Letter PDF ↓Axes from 0 to 10, with positive coordinates. A clear starting point for learning ordered pairs.
A4 PDF ↓ · Letter PDF ↓Plot A (1, 1), B (7, 1) and C (4, 6). Connect them to make a triangle. The second page gives the answer.
A4 + answers ↓ · Letter + answers ↓Portrait orientation. Choose the matching paper size and print at 100% / Actual size. These grids preserve equal X and Y units; a unit is not a fixed millimetre length.
An ordered pair (x, y) tells you where a point sits. Start at the origin (0, 0). Move horizontally by x, then vertically by y. Positive x goes right; negative x goes left. Positive y goes up; negative y goes down.
For A (3, 4), move 3 units right and 4 up. For B (−4, 3), move 4 left and 3 up. Changing the signs changes the quadrant. A point on an axis is not inside a quadrant.
| Point | Coordinates | Position |
|---|---|---|
| A | (3, 4) | Quadrant I |
| B | (−4, 3) | Quadrant II |
| C | (−3, −4) | Quadrant III |
| D | (4, −3) | Quadrant IV |
| O | (0, 0) | Origin |
Download the example points ↓ · Try “Explore four quadrants” in the editor ↑
For a blank handout: choose Blank grid, set the range and download PDF. Hide axis numbers if the task is to label them. No point data is needed.
For a diagram: choose Labelled diagram and open “Edit or paste points.” Enter one point per line, such as A,3,4. Two-column X/Y data is also accepted; labels are assigned A, B, C in row order. CSV commas or pasted spreadsheet tabs separate the columns. An optional header must be X,Y or Label,X,Y.
For practice: choose plotting to start with ordered pairs and an empty graph, or reading to start with labelled points and blank answers. Reveal the answer on screen after attempting the task. The practice PDF always keeps answers off page 1; the optional answer key is a separate page.
The diagram, worksheet and answer key use the same validated point values. X and Y use the same distance per unit, even when their ranges differ. Joining points follows the supplied order and closes the shape; it does not sort points or fit a trend line. Repeated positions are preserved, although nearby labels can overlap.
Use up to 12 points, unique labels of 1–8 letters or numbers, and coordinates between −50 and 50. Fractions such as 1/2 are accepted and converted to numbers; decimal points use a dot. Diagram labels show up to eight decimal places, while CSV retains the numeric values. Each axis must include zero and contain 2–40 intervals. Limits must align with the interval. Out-of-range points are flagged instead of silently removed.
This is a coordinate grid and point-plotting tool. It does not solve algebraic equations or construct geometric proofs. For paired measurements with a regression line, use the scatter plot maker; for a series of measurements, use the line graph maker.
Yes. Select “First quadrant: 0 to 10” under Grid range. If any existing points are negative, edit them or choose the “Plot a triangle” example, which uses positive coordinates. The tool will explain which points do not fit.
No. PDF practice sheets keep the question page separate from the answer key. SVG and PNG downloads reflect the graph currently shown; CSV always contains the points. Use the PDF worksheet when distributing practice to students.
Yes. Print and reuse the original grids and activities for lessons, tutoring or personal study. No account, payment or attribution on your worksheet is required. The original source code is available under the MIT license.
PDF contains a high-resolution page at the selected A4 or Letter size, including the activity and optional answer key. SVG is an editable vector graph. PNG is a 2160 × 2160 graph image for slides or documents. CSV contains the labelled numeric coordinates.
Your edits stay in this browser tab and are not uploaded or saved to an account. Download your work before refreshing or leaving the page. Aggregate analytics events contain only fixed tool and format identifiers.
Go from ordered pairs to slope and line equations, or transform a polygon. Explore all five math tools and worksheets.