Number line generator.

Create a number line with evenly spaced ticks, plot fractions or negative numbers, show equal jumps, or shade a bounded interval. Preview the result, hide it for practice, and download a printable worksheet with a separate answer key.

Need a whole practice set? Make 6–12 number line questions with a separate answer key →

EXPLORE · PRACTISE · PRINTFree · No signup · Stays on your device

2 See how it works

Live preview

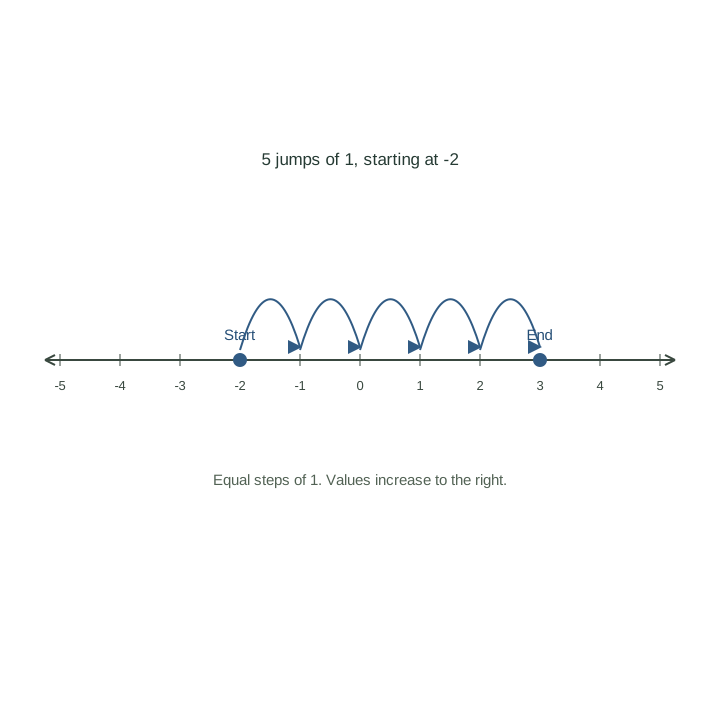
Start at -2. Make 5 jumps of 1.

Number line diagram-5-4-3-2-1012345StartEnd5 jumps of 1, starting at -2Equal steps of 1. Values increase to the right.

Step by step

-2 + 5 × (1) = 3

Each jump goes right.

Values used in this example
PositionValue
0-2
1-1
20
31
42
53

Tick spacing is uniform. Fraction labels use denominators up to 100; other values display to 8 significant digits. CSV keeps numeric precision. Repeated positions remain in the table.

3 Download & use it

PDF includes the problem and space to work. Practice mode can add a separate answer key; Explore mode gives a worked page.

SVG and PNG match the diagram currently shown. CSV includes calculated values, even in practice mode.

Practice PDF page 1 keeps the answers hidden, even after revealing them on screen. PDF pages use high-resolution images.

How to use it

  1. Choose points, jumps, an interval or a blank number line. Set the minimum, maximum and tick interval.
  2. Enter numbers or fractions such as −2, 0.5 or 1/4. Choose open or closed endpoints when shading an interval.
  3. Explore the completed diagram, or switch to practice and draw your answer on paper. Download a worked page or a worksheet with answers.

Cross zero in five jumps.

Start at −2. Five jumps of +1 take you through −1, 0, 1 and 2, ending at 3. The calculation is −2 + 5 × 1 = 3. Each equal jump covers the same physical distance.

Now change the jump size to −1 and start at 3. You travel left and finish at −2. A negative jump changes direction; it does not change the equal spacing of the number line.

Free for class, homework and presentations. Two-page PDFs: question first, answer key second. Print in portrait at 100% / Actual size.

Cross zero in five jumps.

Understand the result

Fractions belong between integers

A step of 1/4 divides each unit into four equal parts. On a line from 0 to 2, there are eight intervals and nine ticks. The point 1/2 falls at the same position as 2/4. Labels use simplified slash fractions with denominators up to 100; other values use decimals rounded to eight significant digits.

An interval describes a set of values

A filled endpoint includes its value; an open endpoint excludes it. For example, [−2, 3) means −2 ≤ x < 3. The shaded segment includes the values between the endpoints. This version supports one finite interval, with neither endpoint beyond the displayed range.

Inputs, spacing and exports

Use a range within −50 to 50 and 2–20 equal intervals; the tick step must divide the range exactly. Plot up to eight values, including repeats, or make 1–10 equal jumps. Every value must fit. PDF supports A4 and US Letter. SVG and PNG show the current diagram; CSV retains numeric values. Blank mode keeps numbered ticks for your own activity.

Further reference: The Math Learning Center: Number Line. Examples, tool design and practice sheets on this page are original ChartsAI work; no affiliation is implied.

Common questions

Can I make a fraction number line?

Yes. Set a fractional tick interval such as 1/2, 1/4 or 1/5, then enter the point values as fractions or decimals. Choose Fraction labels to show simplified fractions where possible.

Can I show subtraction and negative numbers?

Yes. Use a negative jump size to move left, and a range that includes all jumps. For example, start at 3 and make five jumps of −1 to finish at −2.

Can I print just the questions?

Choose Practice mode, select PDF and turn off the separate answer key. The question page keeps the range and instructions but hides the completed points, jumps or shaded interval.

Another way to see the maths.

Slope calculator

For connecting two ordered pairs to rise, run, gradient and the equation of a straight line.

Quadratic graph calculator

For learning how a quadratic equation, its key features and a plotted parabola describe the same function.

Start with coordinate-plane plotting practice, or browse all free math tools.