The comparison at a glance
| Check | Question |
|---|---|
| Baseline | Do lengths represent the actual amounts? |
| Denominator | What total produces each percentage? |
| Order | Does connection or sorting have meaning? |
| Missingness | Were blanks turned into zeros? |
| Measure | Are all values comparable units? |
Check amounts against their reference
If bars represent 90 and 100 but start at 80, their visible lengths are 10 and 20. The second looks twice as long even though 100/90 is only about 1.11. The arithmetic of the data is correct, but the visible length ratio answers a different question. Use a zero baseline for amount-encoding bars.
Read the denominator behind percentages
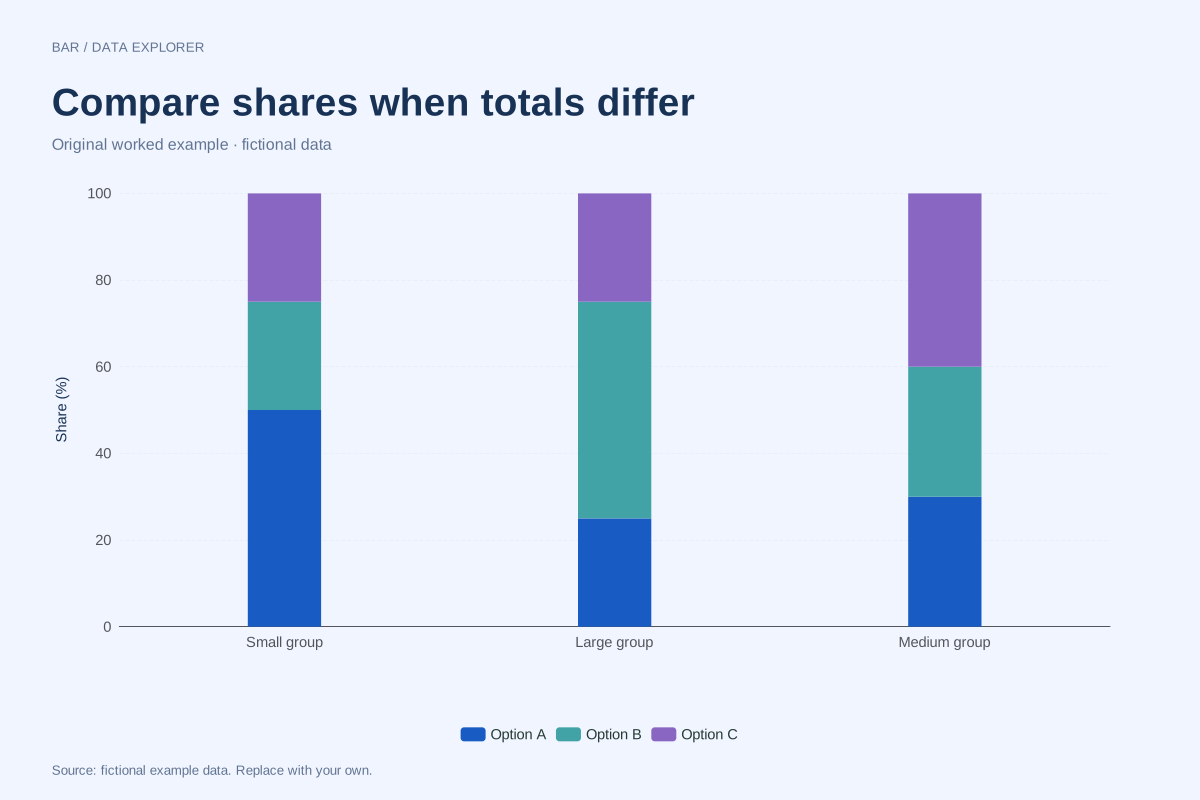
Our percentage-stacked example compares totals of 40, 200 and 100. Every bar reaches 100%, so total size is intentionally hidden. The first series has 20 observations in the small group and 50 in the large group, yet its share is higher in the small group. Keep both counts and shares available to avoid confusing them.
Ask what was connected or omitted
Connecting unrelated categories can imply a progression that does not exist. Removing empty histogram intervals can conceal a gap. Treating a missing cell as zero can invent a change. These are different errors, but each arises from the relationship between data meaning and display geometry. A complete input table helps readers inspect that relationship.
Replace accusation with a reproducible check
A surprising chart is not automatically deceptive. Recreate the plot from its data, state the scale and transformation, and show the specific implication that changes. If source values or definitions are unavailable, describe that limitation. The examples in this library are fictional teaching artifacts with complete input, so the checks can be performed without guessing.
A related chart you can inspect
References and reproducibility
The worked arithmetic and teaching examples on this page are original. Background reading: ONS guidance on axes. Source code and reuse terms expose the implemented calculations.
Written by SupaMakers for ChartsAI · Reviewed September 8, 2026.