How to read this chart
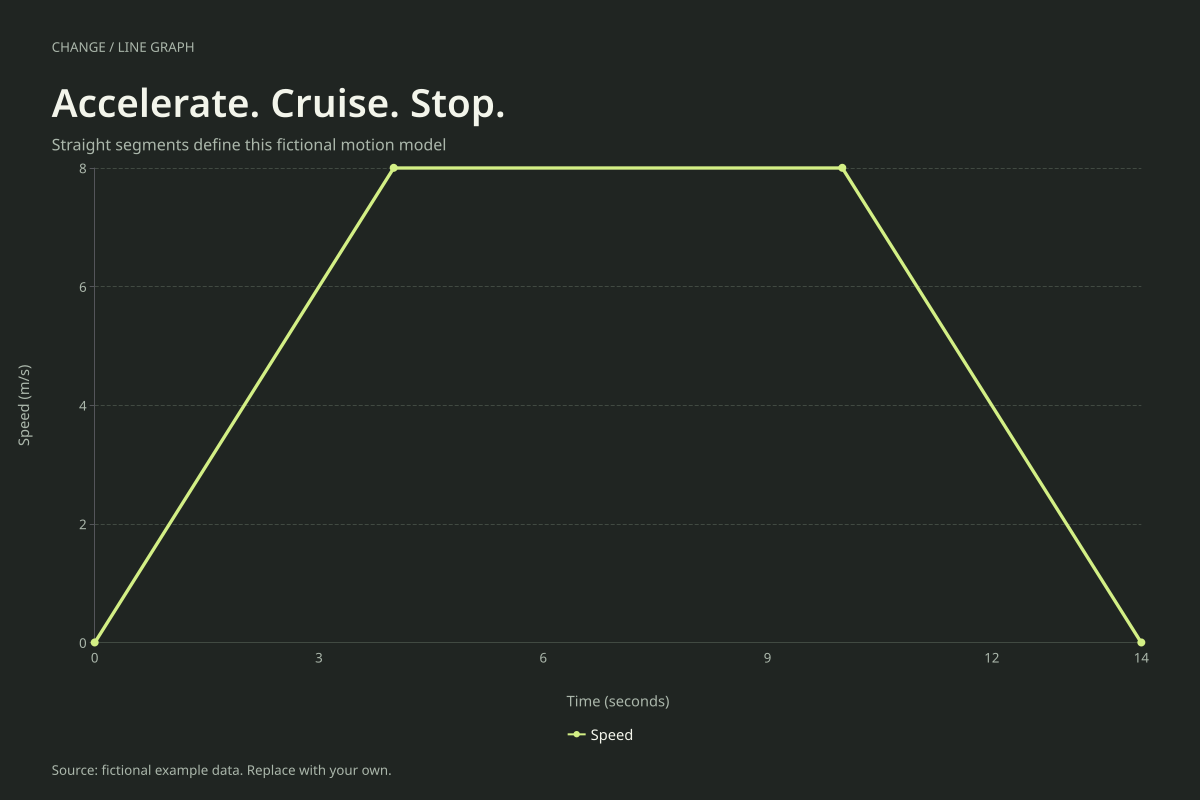
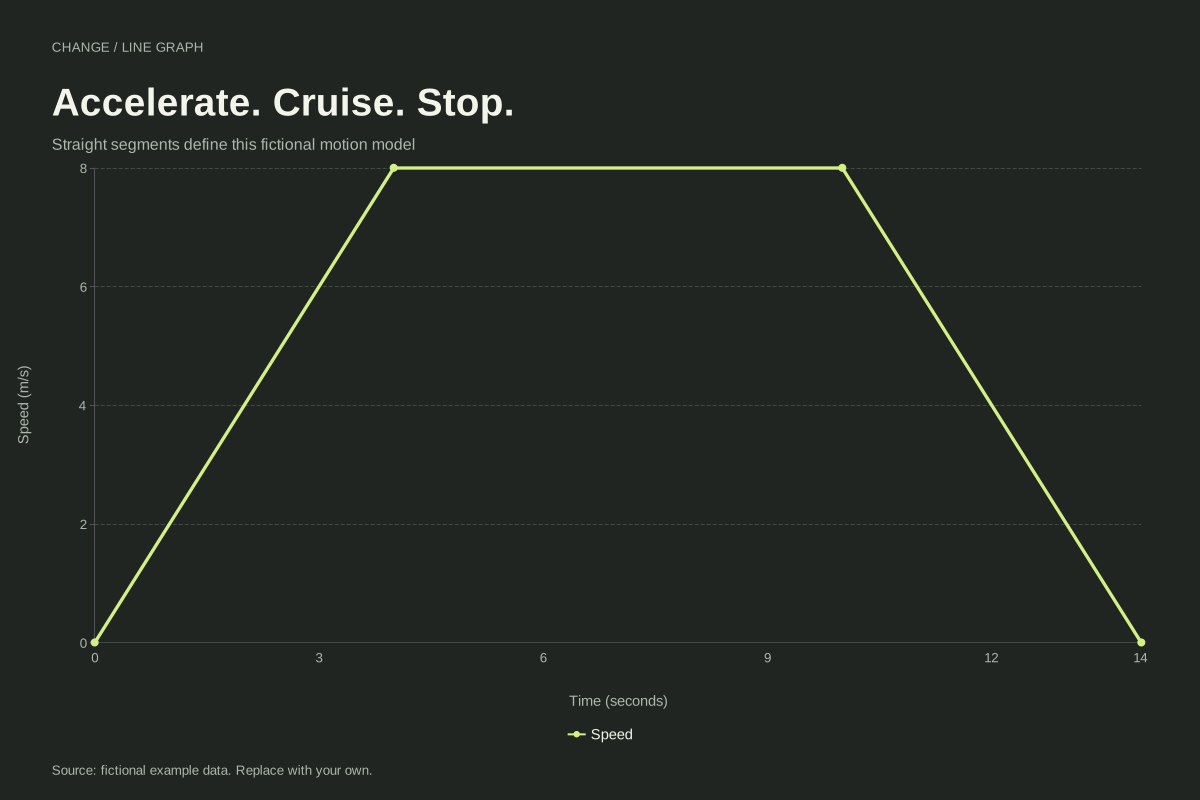
The initial straight segment rises by 8 m/s in 4 seconds, giving an acceleration magnitude of 2 m/s². The flat middle segment represents constant speed, not a stop. The final straight segment decreases speed by 8 m/s in 4 seconds.
Distance is the area under this nonnegative speed curve. The first triangle contributes ½ × 4 × 8 = 16 metres; the rectangle contributes 6 × 8 = 48 metres; the last triangle contributes another 16 metres. Total distance is 80 metres and average speed is 80 ÷ 14, about 5.71 m/s.
Build it with your own data
Choose a numeric horizontal axis with elapsed seconds. Enter the four corner points in increasing time order. The straight connections are part of this piecewise-linear model, so the triangular and rectangular areas have an explicit interpretation.
For your own data, use more observations when the motion changes within an interval. Keep seconds and metres per second consistent or convert units before calculating area. Editing the chart changes the displayed values; the explanatory calculation on this example page remains tied to the original four points.
Open this example in the line graph maker Replace the data, inspect the preview and download your version. SVG, PNG and PDF exports are available in the editor.
What this example cannot tell you
Speed is nonnegative. A velocity–time graph can have negative values and its signed area describes displacement; that is a different quantity. This page does not calculate arbitrary areas automatically or infer acceleration from unobserved motion.
Why is the horizontal middle segment not a pause?
Its height is 8 m/s, so the object keeps moving at that speed. A pause on a speed–time graph lies at zero speed. On a distance–time graph, a pause is instead a horizontal segment at the distance already travelled.
Method background: OpenStax Physics: velocity–time graphs and area. Our dataset and worked calculation are original fictional examples.
Created and reviewed by SupaMakers for ChartsAI · September 8, 2026. Source code and reuse terms.