How to read this chart
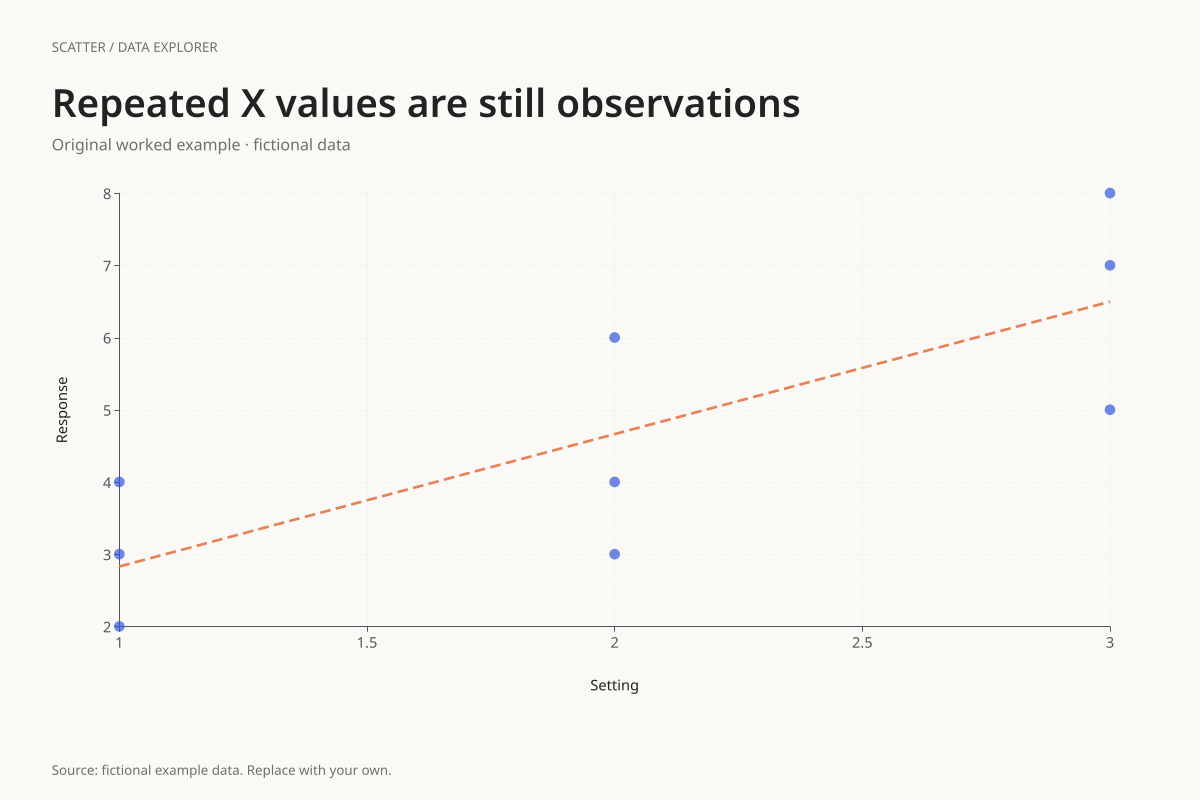
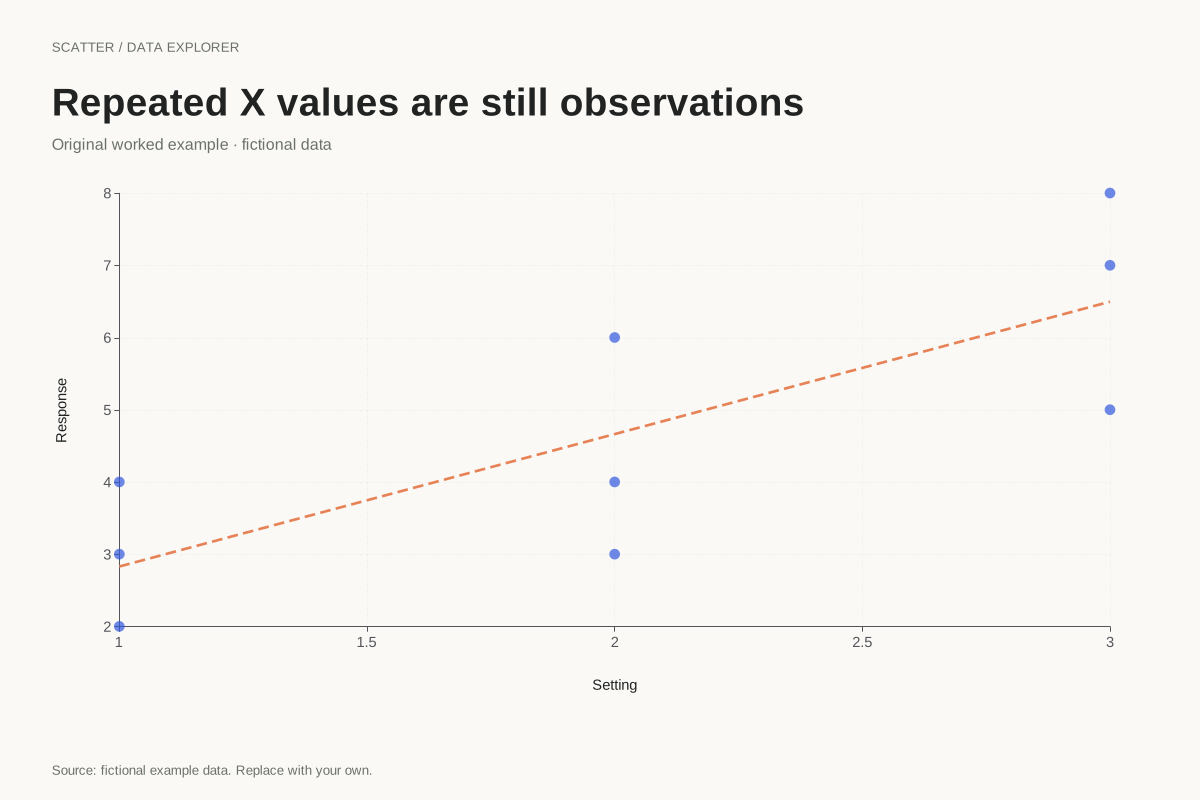
At X = 1, the Y values are 2, 3 and 4. At X = 2 they are 3, 4 and 6, and at X = 3 they are 5, 7 and 8. The corresponding group means are 3, 13/3 and 20/3.
The three points in each vertical group are distinct observations. A scatter plot uses their actual numeric coordinates, so repeated X values share a horizontal position. Connecting them in table order would introduce lines with no defined progression.
Try the calculation yourself
Keep each X/Y pair on the same row when importing. To compare individual observations with group means, calculate a separate summary explicitly and label it as such. The default chart and downloaded CSV continue to show the original nine pairs.
Open this exact example, change the data or calculation settings, and compare the result. The CSV preserves the input rows; the ECharts JSON contains drawing options.
What this example cannot tell you
The small constructed sample supplies no sampling scheme or uncertainty. Repeated positions are not evidence of replication quality by themselves. Exactly overlapping pairs can also hide behind one another, so the table and sample count remain necessary.
Does repeated X prevent a fitted line?
No. The fit is defined as long as the X values vary somewhere in the sample. Repeats at a few X positions are allowed. If every X value were identical, the slope would be undefined and the editor would report that instead of drawing a fitted line.
Calculation convention
Every row supplies one X and one Y measurement for the same observation. The chart does not sort, merge or connect the points. Repeated X values are allowed and repeated pairs remain in the data, although exact overlaps can appear as one mark. Use consistent units and keep subject matching intact before importing.
Method background: NIST: scatter plot interpretation.
Created by SupaMakers for ChartsAI · September 8, 2026. Source and reuse terms.