The comparison at a glance
| Quantity | Describes | Example |
|---|---|---|
| Sample SD | Observation spread | 2.582 |
| SE of mean | Estimated mean sampling variability | 1.291 |
| IQR | Middle-half spread | Different statistic |
| Confidence interval | Method-specific uncertainty interval | Not calculated here |
Work a four-value example
For fictional observations 2, 4, 6 and 8, the mean is 5. Deviations are −3, −1, 1 and 3; squared deviations sum to 20. The sample variance uses n − 1 = 3, giving 20/3. Sample SD is √(20/3), approximately 2.582. The estimated standard error of the mean is 2.582/√4, approximately 1.291.
Keep the denominator convention visible
Dividing the squared-deviation sum by four would instead give a population-style variance of 5 and SD √5. That is a different convention. Here the calculation uses sample SD because it feeds an estimated standard error. State which formula you used when reproducing a result in a spreadsheet or comparing published summaries.
More rows do not always mean more information
The s/√n formula assumes an appropriate sampling structure. Repeated records for the same individual, clustered observations or serial dependence can invalidate the naive treatment of every row as independent. Copying the same four values multiple times into a spreadsheet does not create new independent evidence or justify a more confident conclusion.
Choose and label error bars carefully
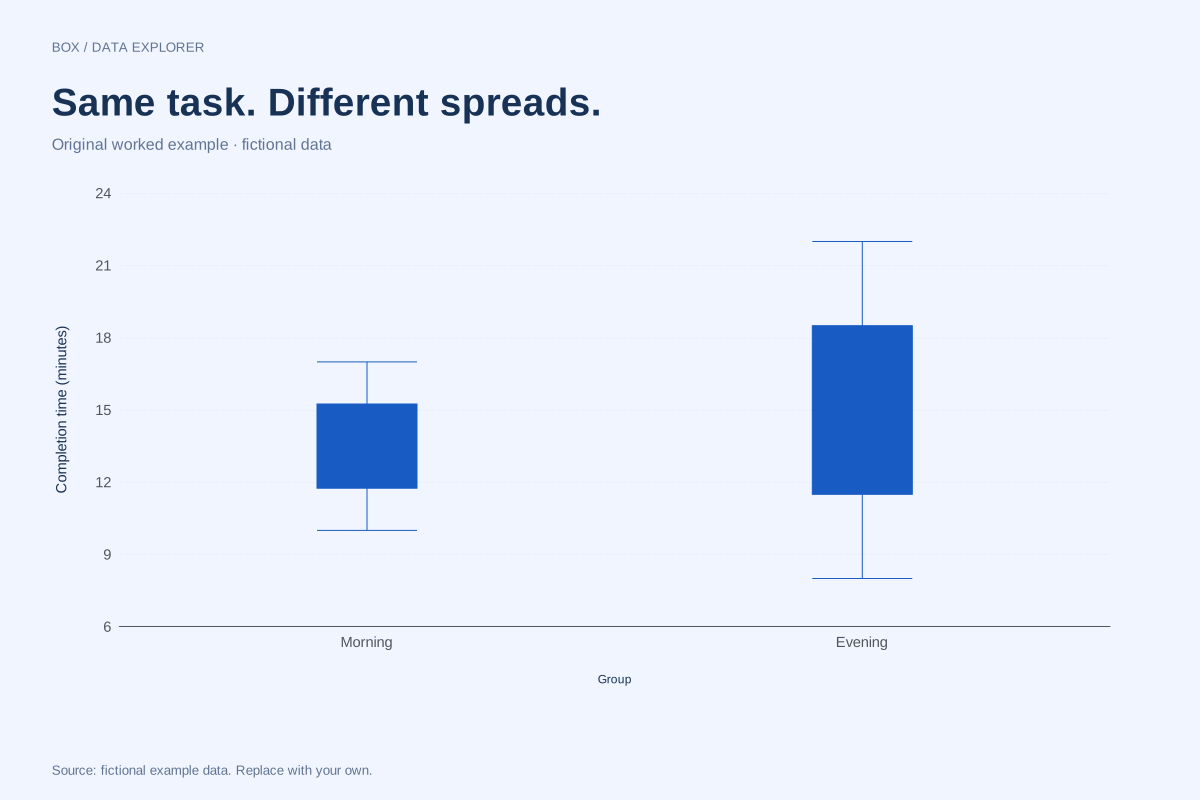
An SD bar and an SE bar communicate different quantities, and neither is automatically a 95% confidence interval. A confidence interval needs a stated method and assumptions. ChartsAI’s current box plots show quartiles and whiskers rather than SD, SE or confidence intervals; do not relabel those summaries as uncertainty bars.
A related chart you can inspect
References and reproducibility
The worked arithmetic and teaching examples on this page are original. Background reading: NIST measures of scale. Source code and reuse terms expose the implemented calculations.
Written by SupaMakers for ChartsAI · Reviewed September 8, 2026.