The comparison at a glance
| Summary | Halves excluding middle | Linear type 7 |
|---|---|---|
| Q1 | 3 | 4 |
| Median | 7 | 7 |
| Q3 | 13 | 10 |
| IQR | 10 | 6 |
Use a sample small enough to inspect
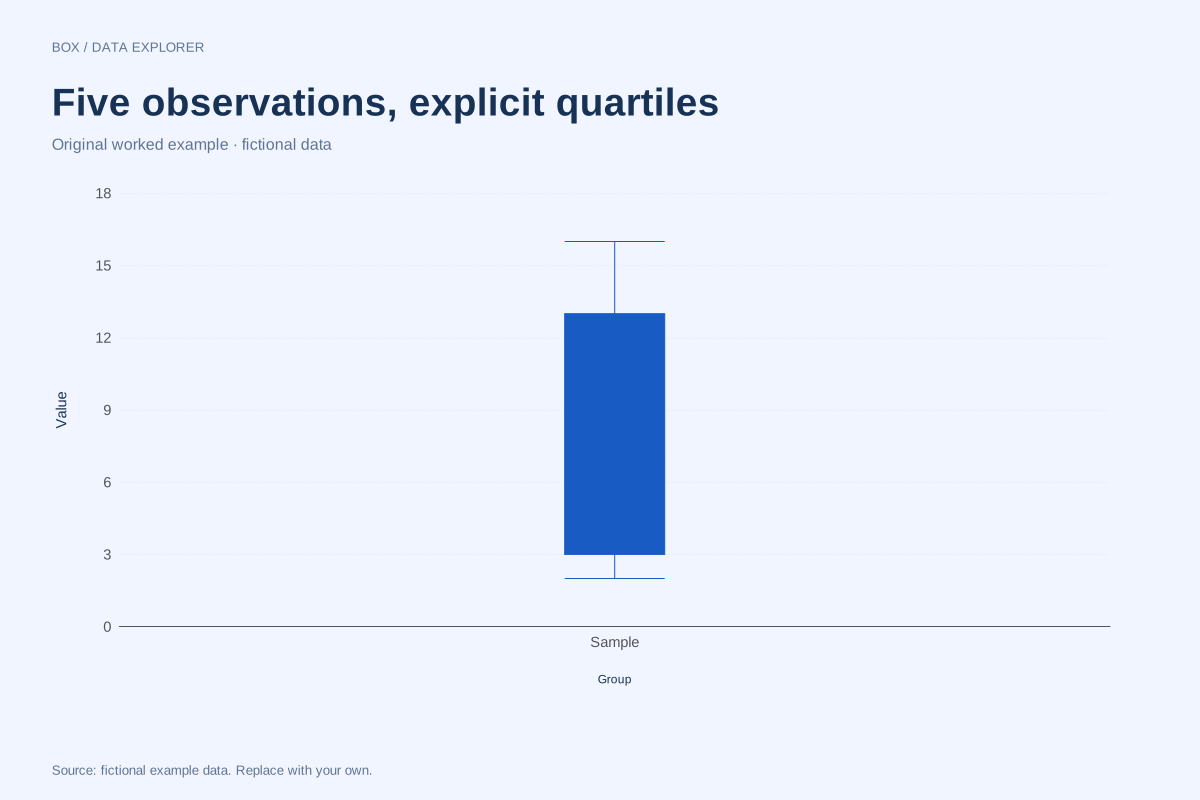
Take the ordered values 2, 4, 7, 10 and 16. The median is 7. For medians of halves, remove that middle observation from the halves: the lower pair is 2 and 4, the upper pair 10 and 16. Their medians give Q1 = 3 and Q3 = 13, with IQR = 10.
Apply linear interpolation separately
For the default linear method, use a zero-based position (n − 1)p. With n = 5, the quarter positions are 1 and 3, landing exactly on the second and fourth observations. Q1 is therefore 4 and Q3 is 10. The median remains 7, but the IQR becomes 6.
Quartile choices affect more than the box
With 1.5 × IQR whiskers, changing Q1 and Q3 also changes the fences used to flag observations. In this particular sample all values remain within either pair of fences. In another sample an observation might switch flag status. That change would follow from the convention, not from a new measurement.
Match a specification rather than a screenshot
If coursework, a report or another application expects a particular quartile rule, choose and name it explicitly. A screenshot alone may not reveal the algorithm. Download the raw CSV and inspect the calculated table. The editor preserves every observation and lets you compare methods without silently replacing the original list.
A related chart you can inspect
References and reproducibility
The worked arithmetic and teaching examples on this page are original. Background reading: R quantile algorithms. Source code and reuse terms expose the implemented calculations.
Written by SupaMakers for ChartsAI · Reviewed September 8, 2026.