How to read this chart
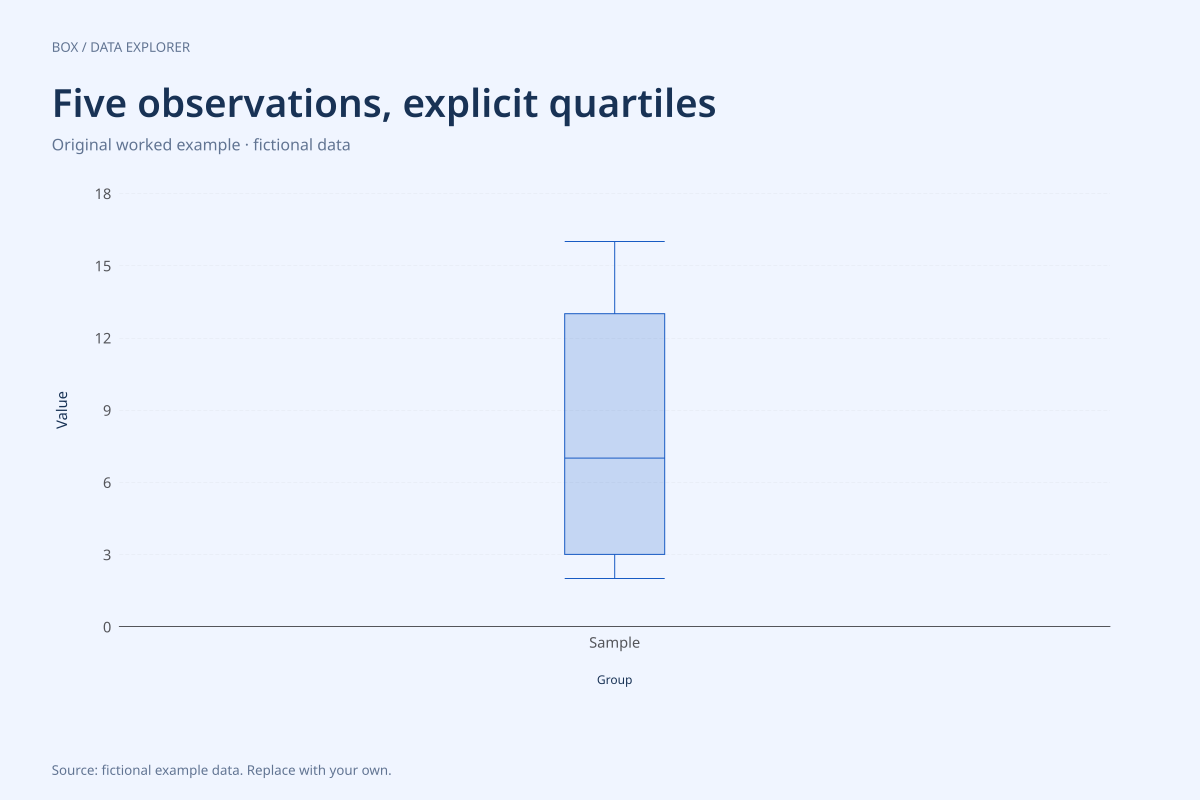
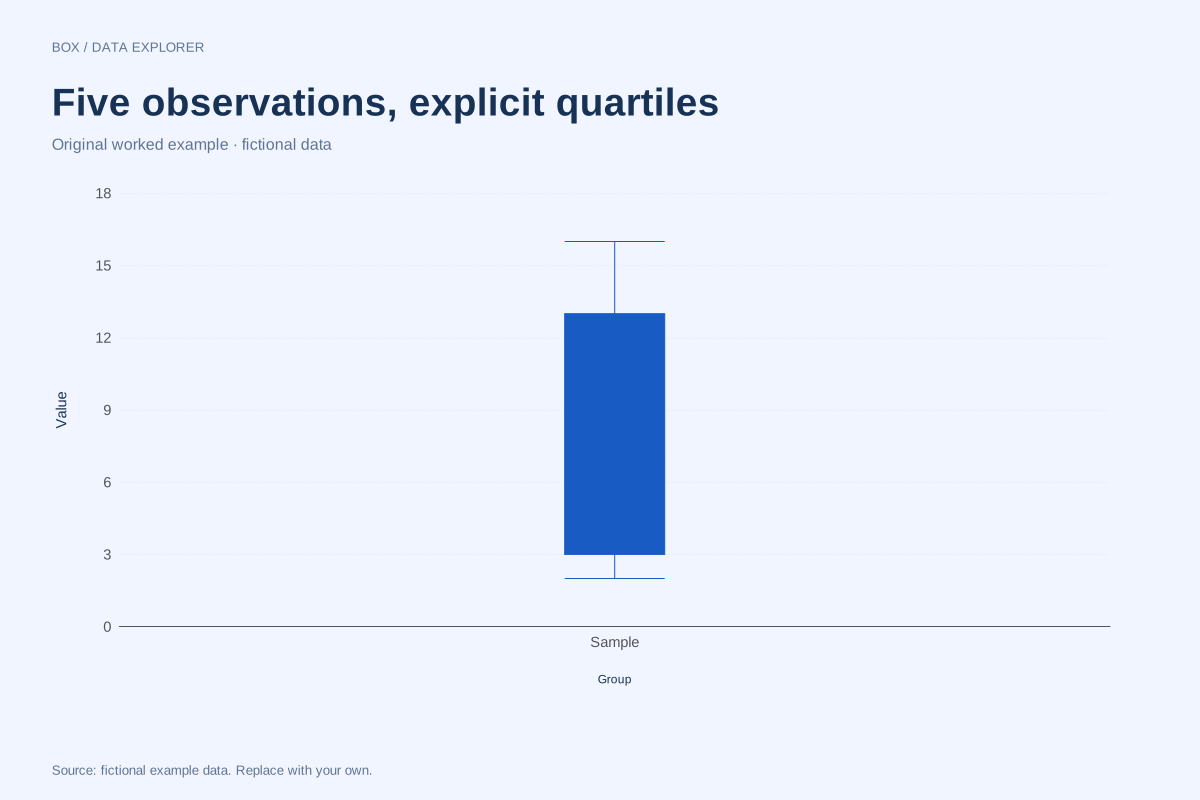
The overall median is 7. The lower half contains 2 and 4, so Q1 is 3. The upper half contains 10 and 16, so Q3 is 13. The IQR is 10, and the fences are −12 and 28. All observations lie inside them.
Switching to linear interpolation gives Q1 = 4 and Q3 = 10, with IQR = 6. The median stays 7. The two methods use the same input but locate quartiles differently; this matters particularly when only a few observations are available.
Try the calculation yourself
Open the example and change the quartile method. Compare the calculated table, not just the box edges. Document the method when submitting coursework or matching another application, since an unspecified quartile convention can explain an apparent disagreement.
Open this exact example, change the data or calculation settings, and compare the result. The CSV preserves the input rows; the ECharts JSON contains drawing options.
What this example cannot tell you
Five observations provide a sparse description of a distribution. A box plot compresses that already small sample; inspecting all five values or drawing a dot plot can be more informative. Neither quartile convention supplies uncertainty estimates.
Which quartile method is correct?
Both are defined conventions. The appropriate choice depends on the specification you need to follow. This example starts with medians of halves excluding the middle value; the editor also offers R type 7 linear interpolation and labels the choice explicitly.
Calculation convention
The default uses linear interpolation at rank (n − 1)p in the sorted sample, equivalent to R quantile type 7. At p = 0.25, 0.5 and 0.75 this gives Q1, the median and Q3. The alternate method takes medians of the lower and upper halves, excluding the middle observation when the sample size is odd. These methods can give different results for the same small sample.
Method background: NIST: box plot and fence interpretation. R documentation: quantile methods.
Created by SupaMakers for ChartsAI · September 8, 2026. Source and reuse terms.