The comparison at a glance
| Quantity | Value |
|---|---|
| Q1 / Q3 | 4 / 7 |
| IQR | 3 |
| Fences | −0.5 / 11.5 |
| Whiskers | 2 / 8 |
| Flagged observation | 30 |
Calculate the cutoff before reading the whisker
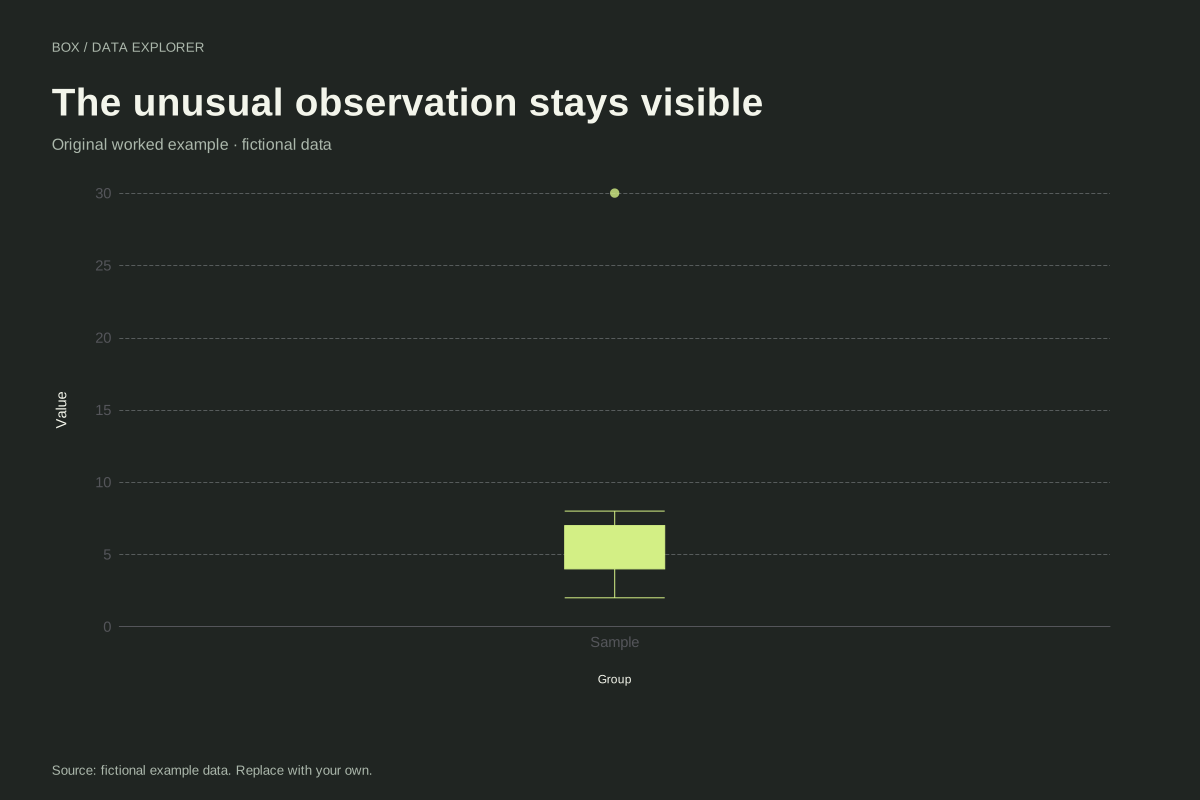
Our nine values are 2, 3, 4, 4, 5, 6, 7, 8 and 30. Under linear-interpolated quartiles, Q1 = 4 and Q3 = 7, so IQR = 3. The lower fence is 4 − 4.5 = −0.5 and the upper fence is 7 + 4.5 = 11.5. The value 30 exceeds the upper fence.
The fence is not an extra observation
The smallest eligible observation is 2 and the largest is 8. Those are the whisker endpoints. Drawing a whisker to 11.5 would use the calculated boundary rather than the convention implemented here. The original maximum remains 30 and appears as a separate point. Nothing has been removed from the data.
A flag calls for context
A point beyond a fence may reflect a valid extreme, a recording error, mixed groups or another process. The box plot cannot decide among those explanations. Check the source record and collection method. If you make an exclusion, document the reason and compare results with and without it rather than silently cleaning the picture.
Compare display conventions explicitly
Switching to minimum-to-maximum whiskers makes the upper whisker reach 30 and removes the separate flag in this display. It does not make 30 less extreme or alter the median. The quartile method also matters because it defines the IQR used in the fence calculation. State both conventions when sharing.
A related chart you can inspect
References and reproducibility
The worked arithmetic and teaching examples on this page are original. Background reading: NIST box plot definition. Source code and reuse terms expose the implemented calculations.
Written by SupaMakers for ChartsAI · Reviewed September 8, 2026.