The comparison at a glance
| Step | Calculation |
|---|---|
| Centred X squares | 42 |
| Centred cross-products | 50 |
| Slope | 50/42 = 25/21 |
| Intercept | 9/14 |
| Residual at (3,5) | 11/14 |
Reproduce the fitted coefficients
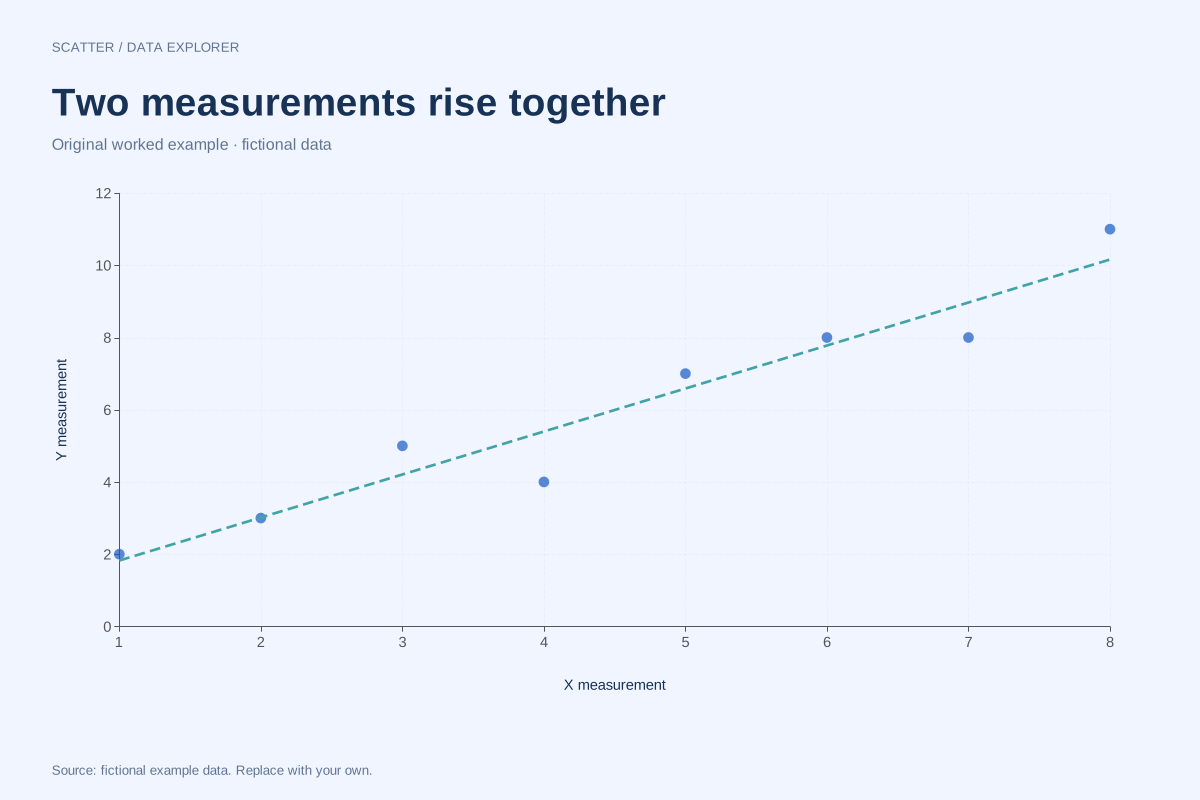
Our positive-association example has eight pairs, mean X = 4.5 and mean Y = 6. The sum of (X − 4.5)² is 42 and the sum of (X − 4.5)(Y − 6) is 50. The slope is 50/42 = 25/21, approximately 1.190476. The intercept is 6 − (25/21) × 4.5 = 9/14, approximately 0.642857.
Read a residual at one point
At X = 3, the fitted Y is (25/21) × 3 + 9/14 = 59/14, approximately 4.214286. The observed Y is 5, so the vertical residual is 11/14, approximately 0.785714. Squaring residuals prevents positive and negative deviations from cancelling in the fitting objective.
Know what the calculation assumes
This line includes an intercept and minimizes vertical errors in Y. Fitting through the origin or treating measurement error in both axes produces a different problem. A good-looking line does not establish causality, validate a linear model or supply uncertainty. Inspect curvature and unusual points before treating coefficients as a useful description.
Do not extend the claim beyond the data
The maker draws its fitted line between the smallest and largest observed X values. Extrapolation would require an additional assumption about the relationship outside that range. If all X values are identical, the denominator is zero and the slope is undefined; the editor reports that instead of fabricating a line.
A related chart you can inspect
References and reproducibility
The worked arithmetic and teaching examples on this page are original. Background reading: NIST scatter plot background. Source code and reuse terms expose the implemented calculations.
Written by SupaMakers for ChartsAI · Reviewed September 8, 2026.