How to read this chart
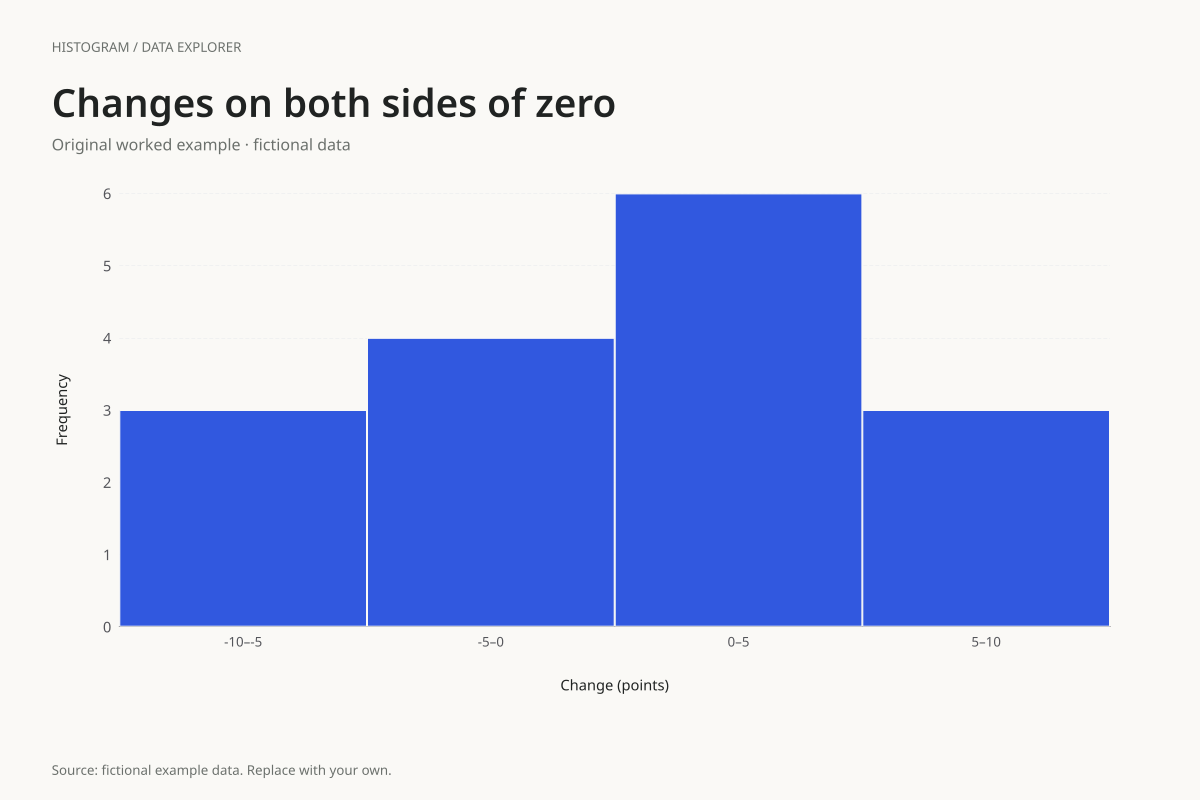
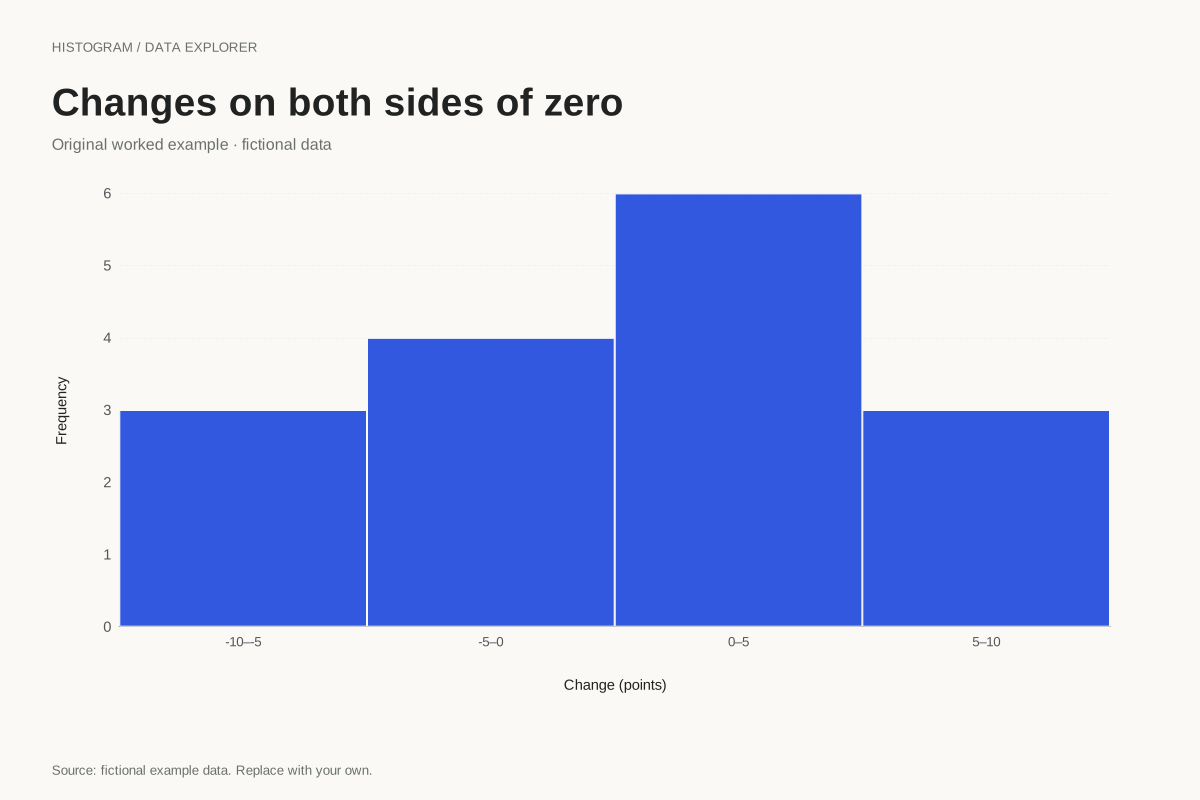
The interval counts are 3 for [−10, −5), 4 for [−5, 0), 6 for [0, 5), and 3 for [5, 10]. The two observations at zero both belong to the third interval under the lower-inclusive convention. All sixteen observations are retained.
Seven values are negative, two are zero and seven are positive. The histogram combines zeros with small positive differences, so the bars alone do not expose that exact balance. The raw list answers the sign-count question more directly.
Try the calculation yourself
Compare the histogram with a dot plot when you need readers to distinguish exact zeros from small changes. Keep the sign convention in the axis label: a negative difference could mean below a reference or a decrease, depending on how you calculated it.
Open this exact example, change the data or calculation settings, and compare the result. The CSV preserves the input rows; the ECharts JSON contains drawing options.
What this example cannot tell you
These differences are invented. A symmetric count of positive and negative observations does not imply a zero mean or a symmetric distribution. The meaning of the reference point must come from the measurement definition.
Should negative observations be converted to positive values?
Only if your actual question concerns absolute magnitude and you explicitly transform the data. Taking absolute values discards direction and changes the distribution. This chart keeps the supplied signs and treats negative values as valid numeric observations.
Calculation convention
A histogram counts individual observations inside numeric intervals. Use the bin-count control for an initial equal-width partition, or enter a start and width for boundaries you can explain. Entering a width overrides the count. The chart supports at most 50 bins; it asks you to increase width when the requested range would exceed that limit.
Method background: NIST: histogram definitions and uses.
Created by SupaMakers for ChartsAI · September 8, 2026. Source and reuse terms.