Four charts.
Different questions.
A before-and-after chart can show an increase while hiding a reversal in between. This worked resource uses the same World Bank life expectancy data to compare four useful views: paired endpoints, a slopegraph, full annual paths and a one-year bar chart.
By ChartsAI / SupaMakers · Reviewed September 9, 2026. Data: 2000–2023, retrieved September 9, 2026.
What is being measured?
The World Bank indicator SP.DYN.LE00.IN reports life expectancy at birth in years, using UN Population Division and national sources. It is a period population estimate based on mortality patterns, not a prediction of an individual person’s lifespan. India, Brazil, Japan and the United States are a deliberate illustrative selection, not a representative sample of the world.
Which endpoints changed?
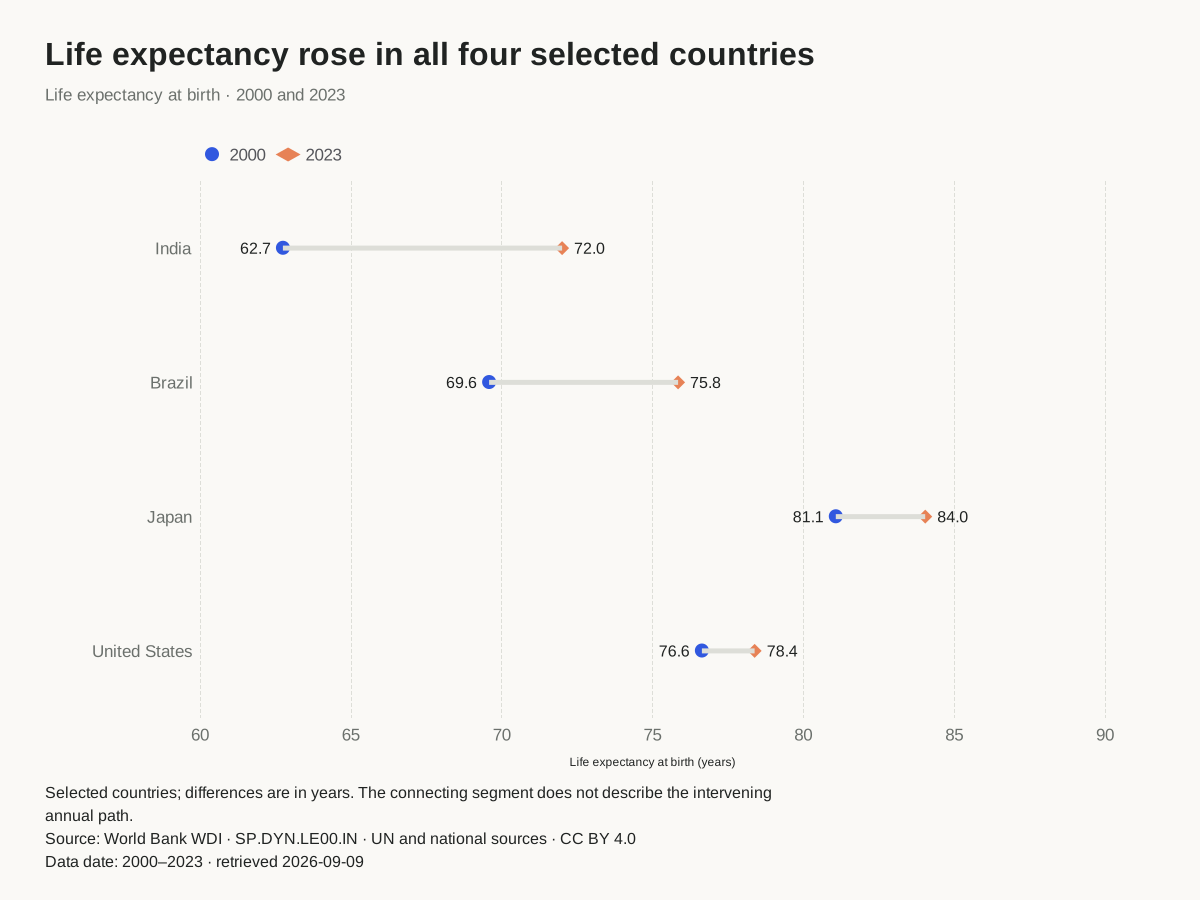
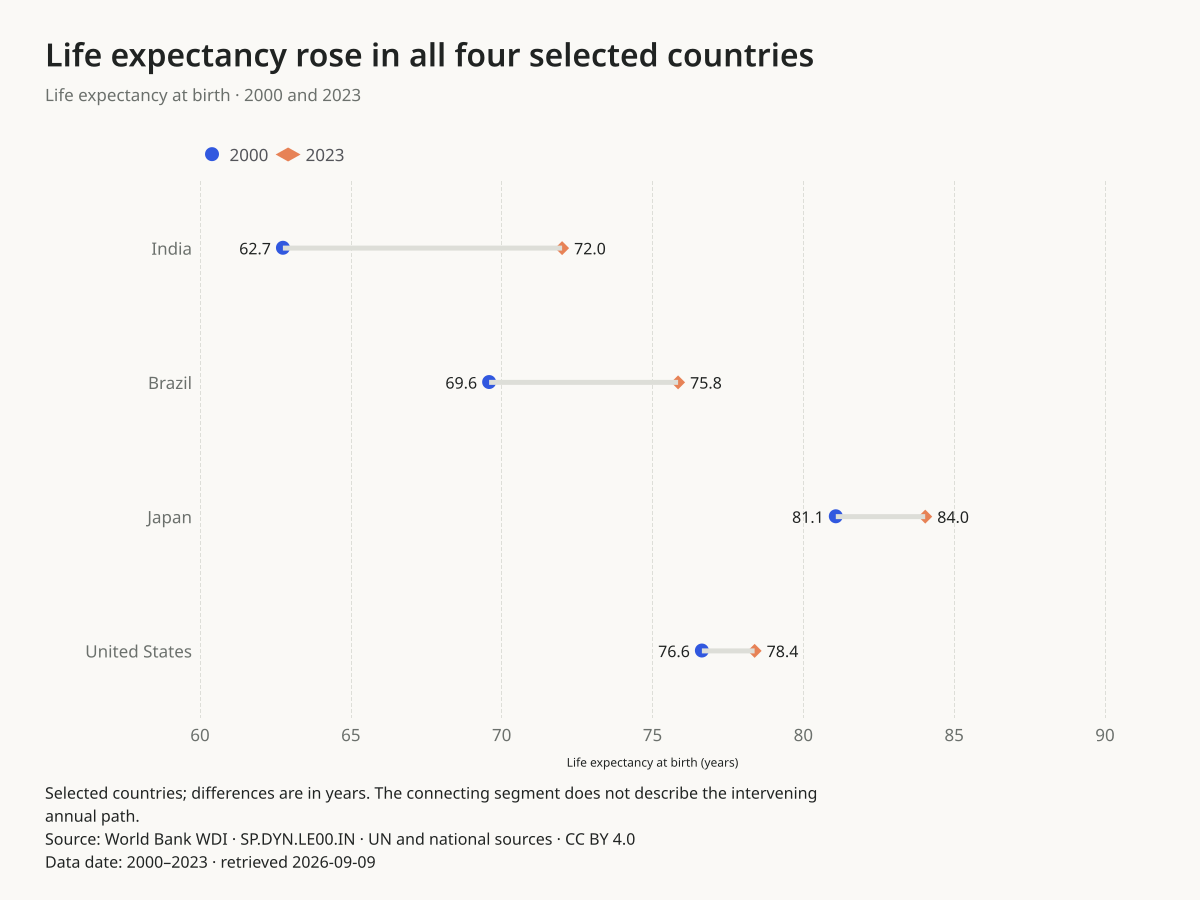
How do the two periods compare?
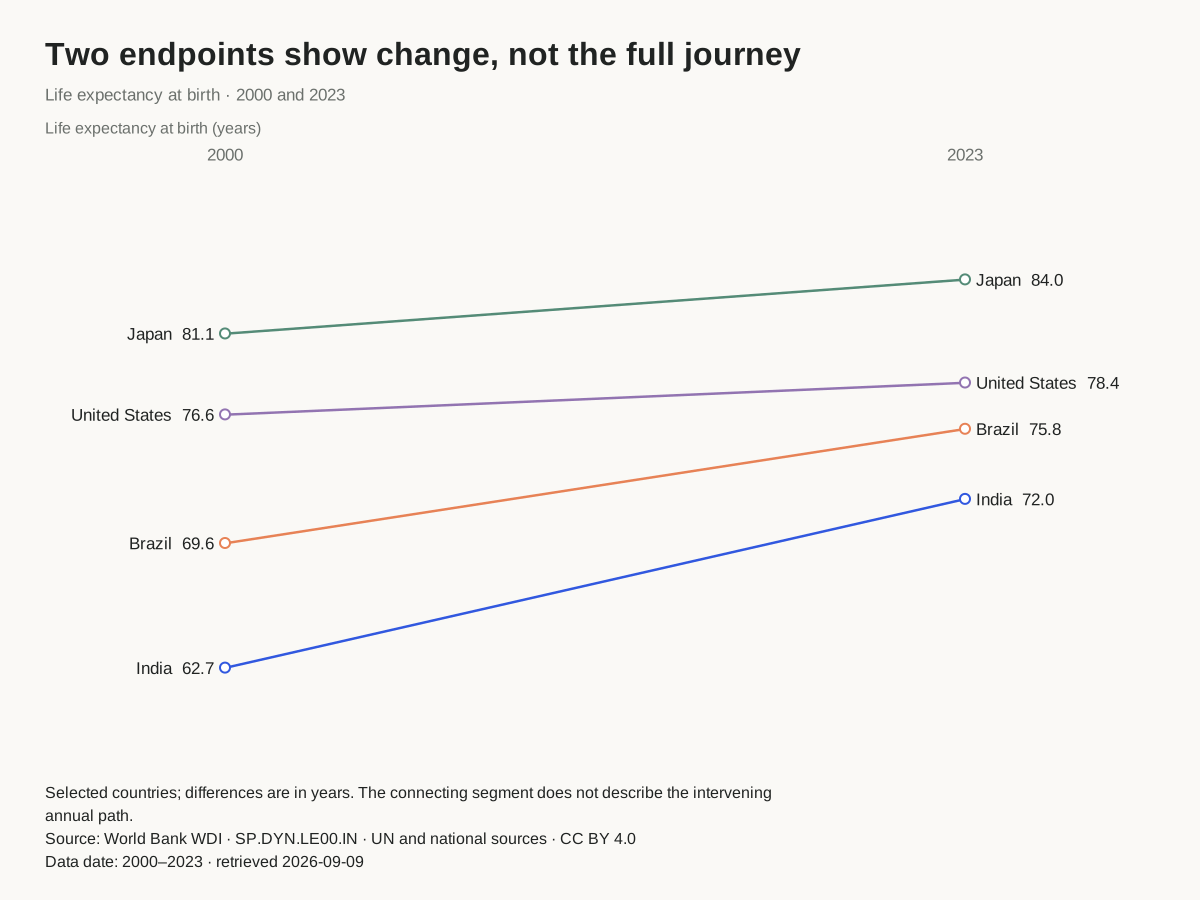
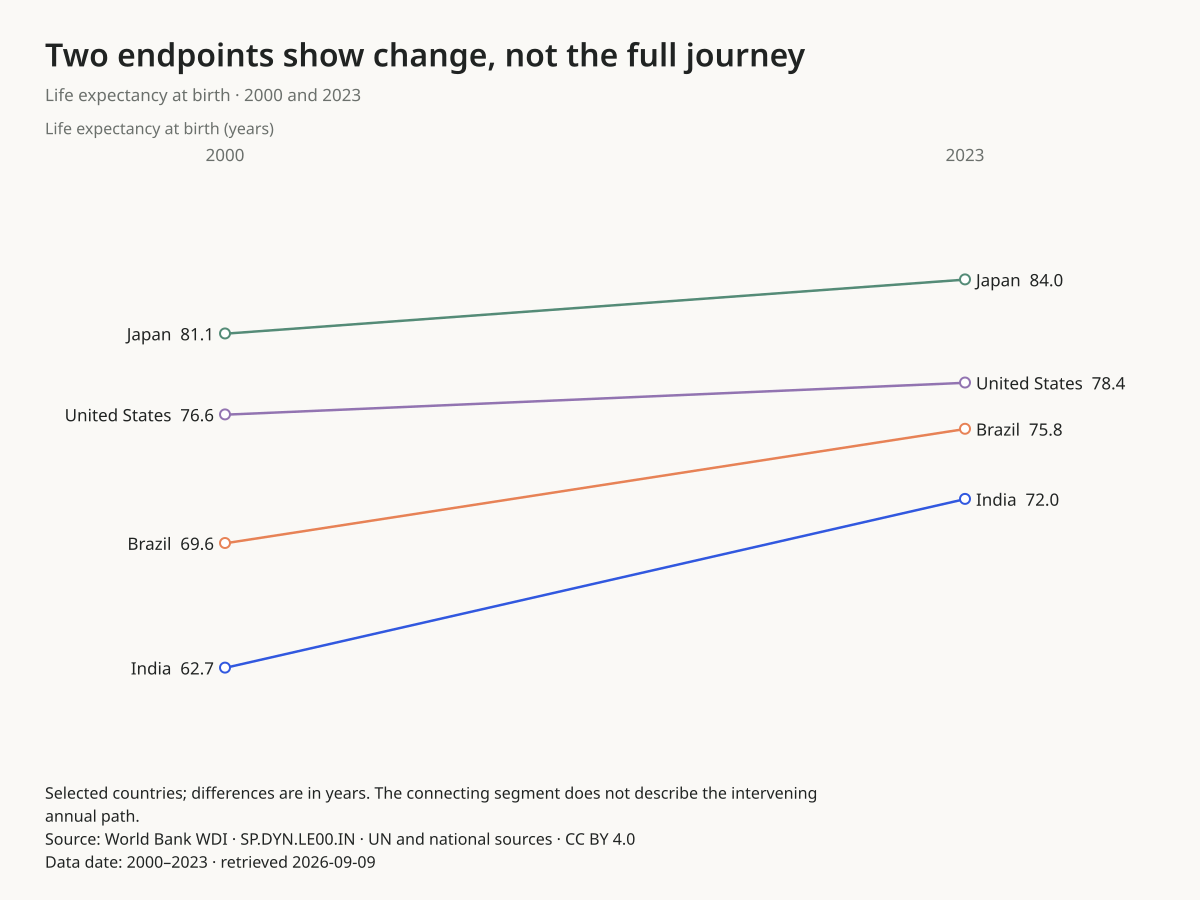
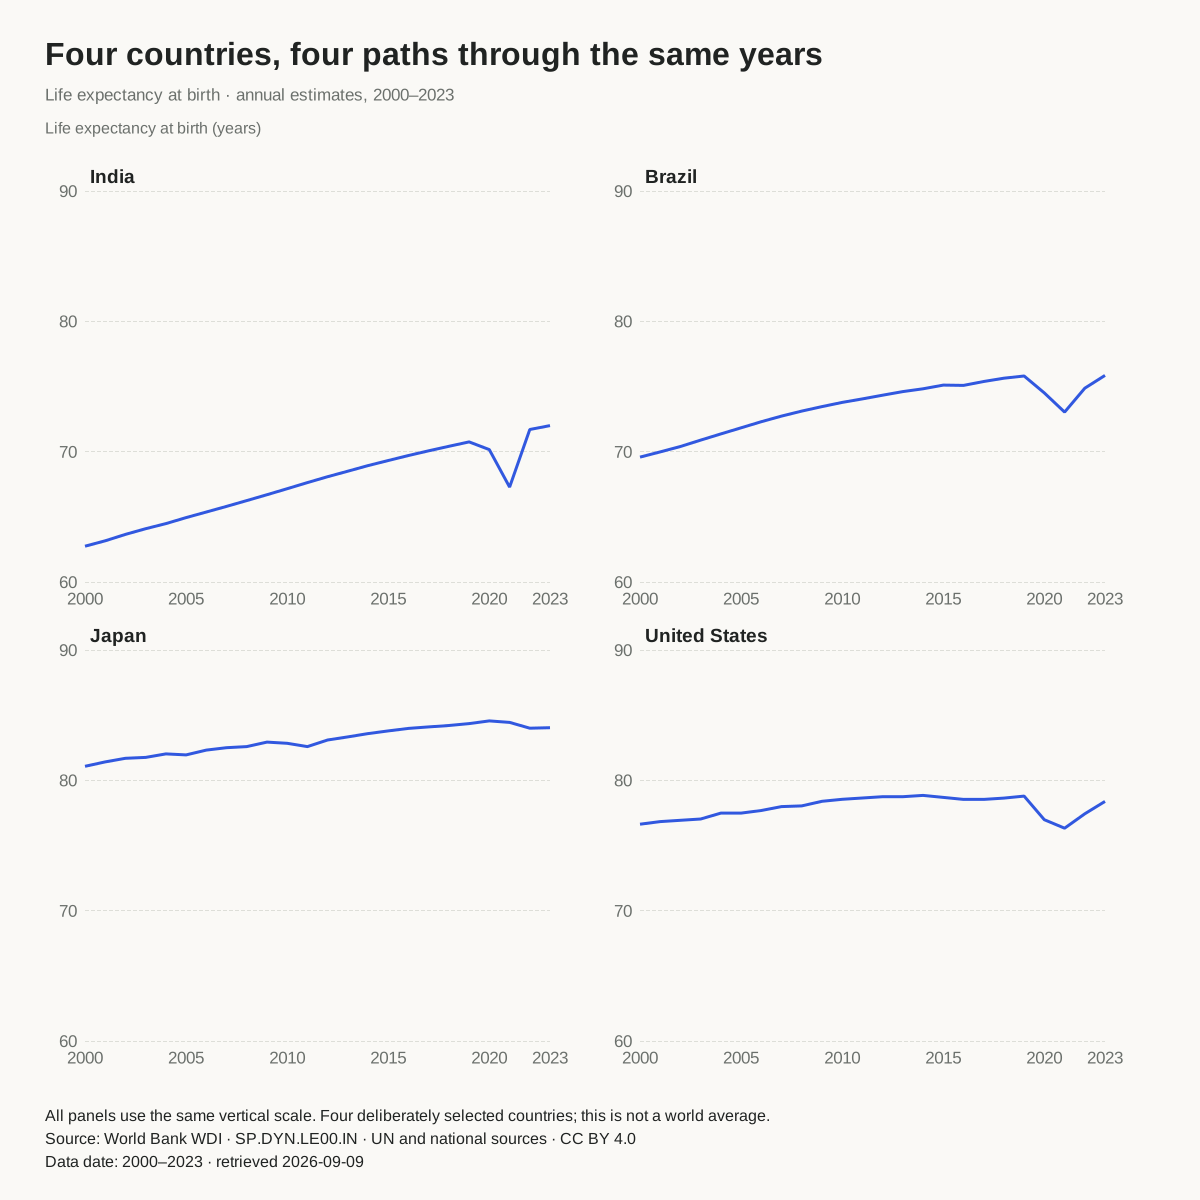
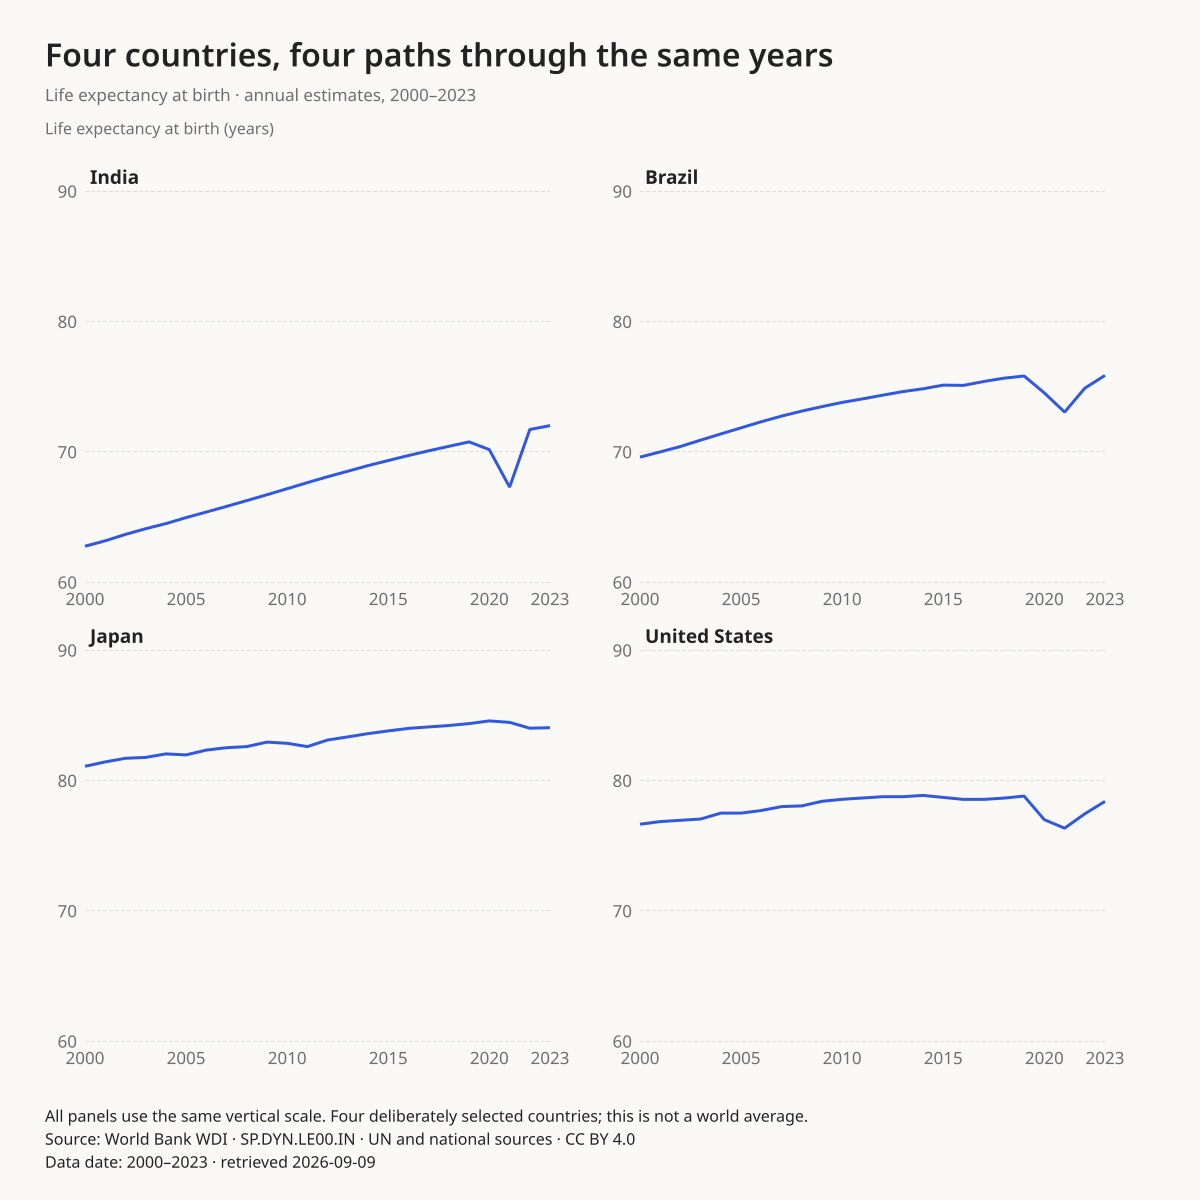
What happened between the endpoints?
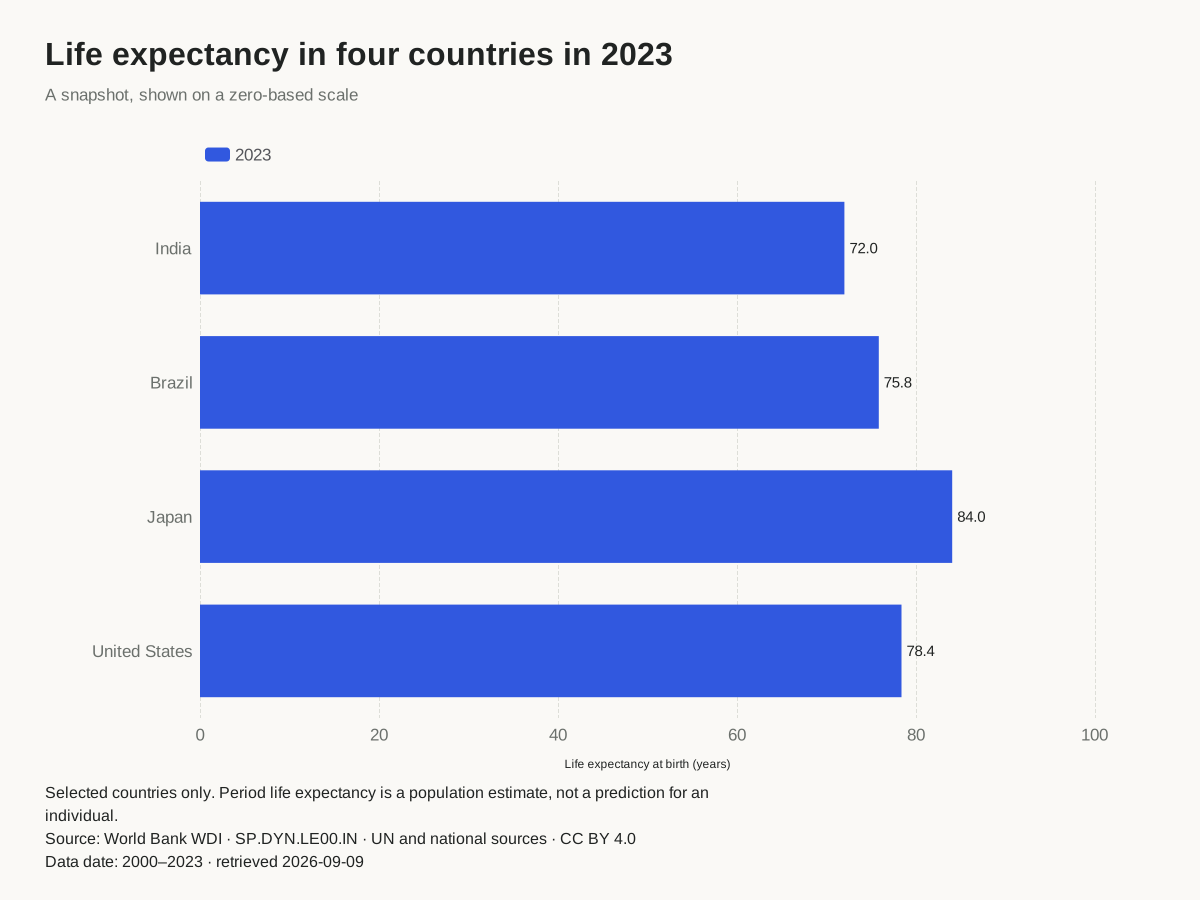
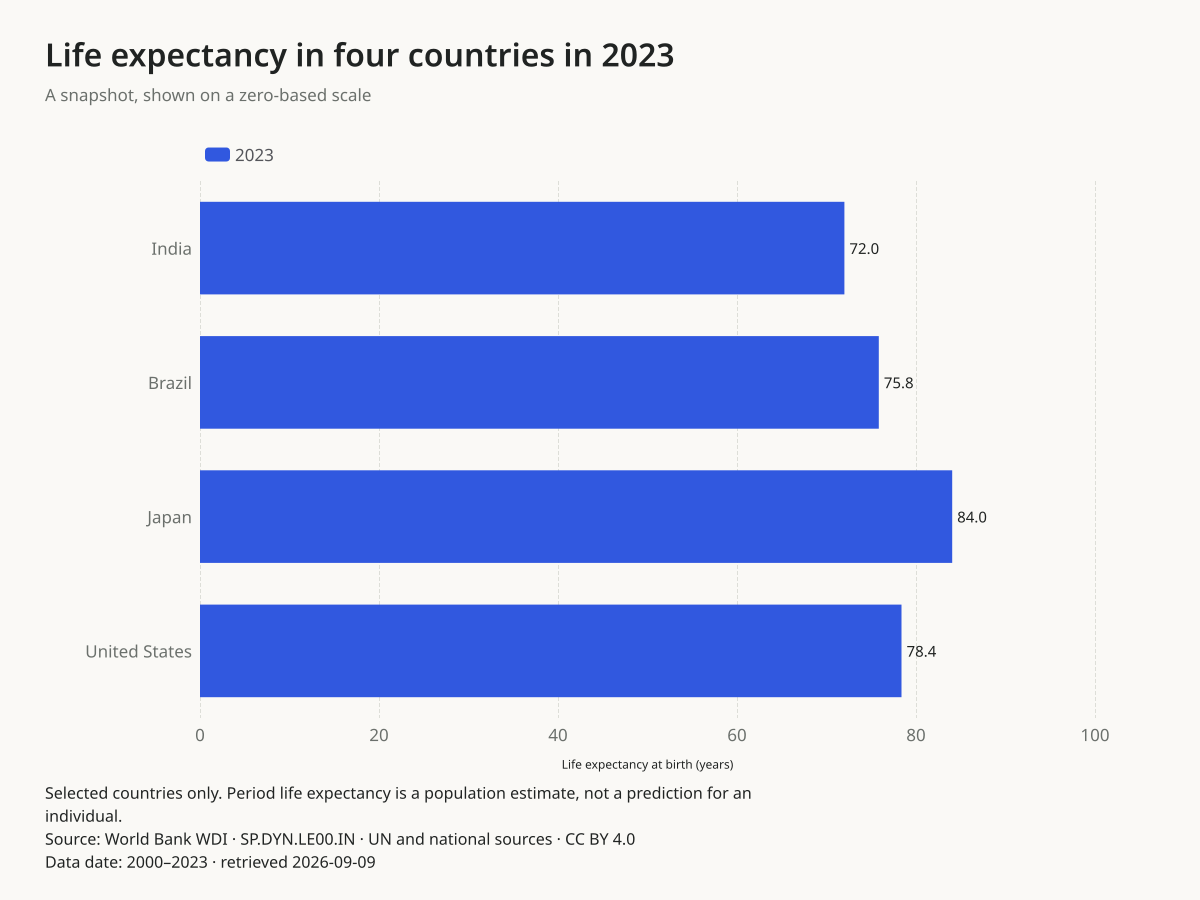
What were the 2023 levels?
Calculate the difference without overstating it
For India, the selected estimates are 62.749 years in 2000 and 72.003 in 2023: 72.003 − 62.749 = 9.254 years. Brazil’s difference is 75.848 − 69.584 = 6.264 years. These are absolute differences in years, not percentage points. All four selected countries have higher 2023 endpoints; the full annual series is needed to assess the intervening path.
The source supplies estimates at different decimal precision. Chart labels round to one decimal for reading; downloads preserve the full supplied precision. Precision in the file should not be mistaken for certainty of the estimates. No causal effect, forecast or global average is calculated here.
Data, provenance and reuse
We retained all 96 observations from the four-country, 2000–2023 API selection. The endpoint charts select the first and last year; the bar chart selects the last year; the panels retain every annual row. No missing values occurred in this selection and none were filled. Rows are in increasing year order.
World Bank data is offered under CC BY 4.0 on the indicator page. Credit World Bank WDI and its underlying sources, link the indicator and license, and identify your changes. Our charts and selection do not imply World Bank endorsement.
All 24 annual rows · unit: years
| Year | India | Brazil | Japan | United States |
|---|---|---|---|---|
| 2000 | 62.749 | 69.584 | 81.0760975609756 | 76.6365853658537 |
| 2001 | 63.158 | 69.98 | 81.4163414634146 | 76.8365853658537 |
| 2002 | 63.649 | 70.396 | 81.6907317073171 | 76.9365853658537 |
| 2003 | 64.086 | 70.884 | 81.76 | 77.0365853658537 |
| 2004 | 64.484 | 71.361 | 82.030243902439 | 77.4878048780488 |
| 2005 | 64.939 | 71.832 | 81.9551219512195 | 77.4878048780488 |
| 2006 | 65.373 | 72.296 | 82.3219512195122 | 77.6878048780488 |
| 2007 | 65.803 | 72.73 | 82.5070731707317 | 77.9878048780488 |
| 2008 | 66.247 | 73.111 | 82.5875609756098 | 78.0390243902439 |
| 2009 | 66.7 | 73.457 | 82.9314634146342 | 78.390243902439 |
| 2010 | 67.162 | 73.779 | 82.8426829268293 | 78.5414634146342 |
| 2011 | 67.623 | 74.047 | 82.5912195121951 | 78.6414634146341 |
| 2012 | 68.076 | 74.335 | 83.0960975609756 | 78.7414634146342 |
| 2013 | 68.499 | 74.609 | 83.3319512195122 | 78.7414634146342 |
| 2014 | 68.932 | 74.823 | 83.5878048780488 | 78.8414634146341 |
| 2015 | 69.326 | 75.106 | 83.7939024390244 | 78.690243902439 |
| 2016 | 69.709 | 75.081 | 83.9848780487805 | 78.5390243902439 |
| 2017 | 70.068 | 75.383 | 84.099756097561 | 78.5390243902439 |
| 2018 | 70.415 | 75.633 | 84.2109756097561 | 78.6390243902439 |
| 2019 | 70.746 | 75.809 | 84.3563414634146 | 78.7878048780488 |
| 2020 | 70.156 | 74.506 | 84.56 | 76.9804878048781 |
| 2021 | 67.282 | 73.038 | 84.4456097560976 | 76.3292682926829 |
| 2022 | 71.698 | 74.872 | 83.9963414634146 | 77.4341463414634 |
| 2023 | 72.003 | 75.848 | 84.0412195121951 | 78.3853658536585 |
Use the right chart for the claim
Choose a dumbbell when the gap is the focus, a slopegraph when the pair of periods is the organizing idea, or small multiples when the annual path matters. Read the publishing guide before embedding the result. This is one reusable worked resource, not four competing pages about the same dataset.