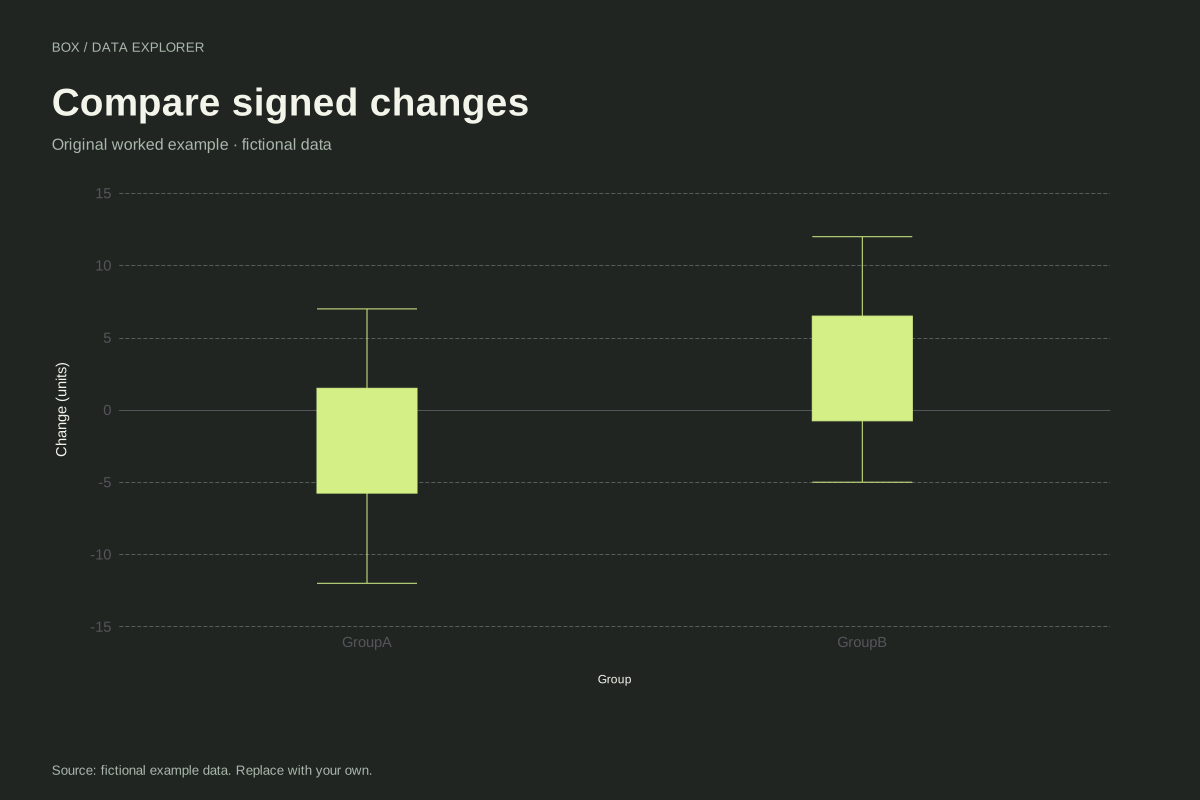
How to read this chart
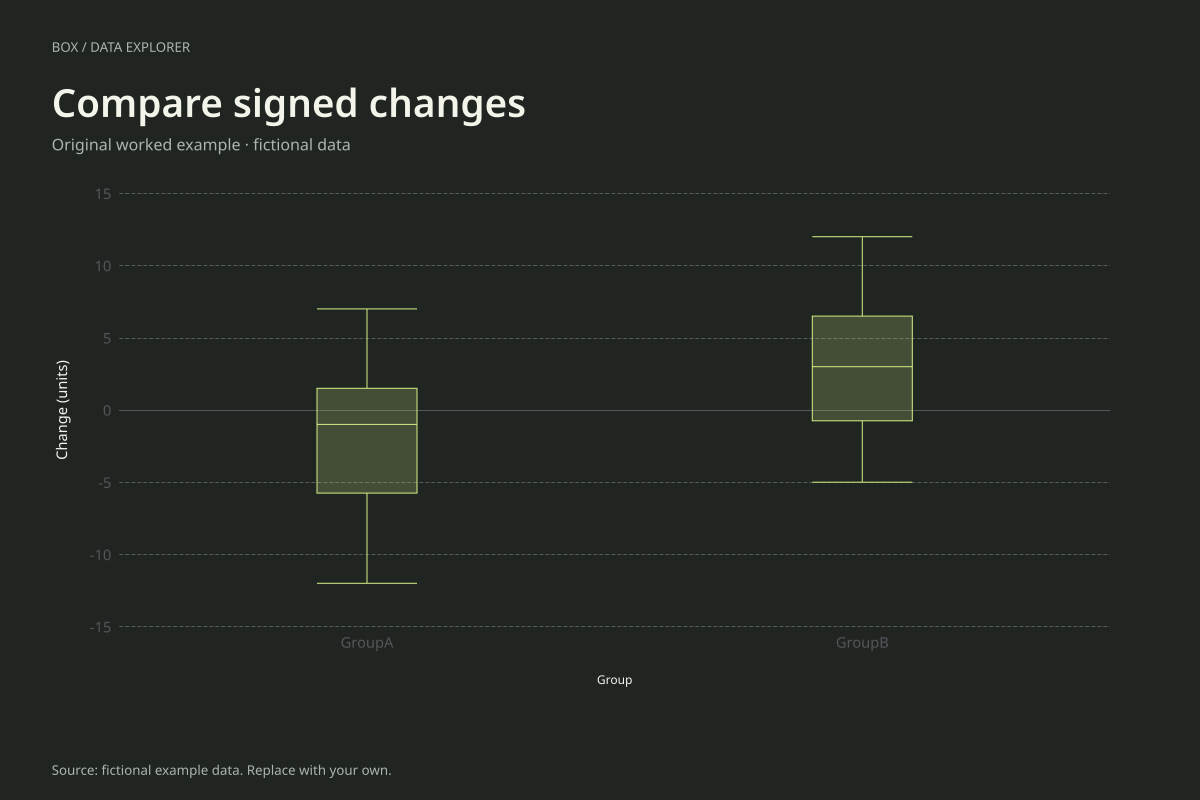
Group A contains −12, −8, −5, −2, 0, 1, 3 and 7. Its median is −1, halfway between −2 and 0. Group B contains −5, −3, 0, 2, 4, 6, 8 and 12, giving a median of 3.
The central positions differ by four units. That is a difference between sample medians, not the median of paired differences. The rows are grouped observations and do not establish that each Group A value matches a particular Group B value.
Try the calculation yourself
Inspect the group counts and original values before interpreting the shift. If the measurements represent before-and-after changes for the same people, prepare one difference per person using a consistent subtraction order. Keep the unit and sign definition in your title or source note.
Open this exact example, change the data or calculation settings, and compare the result. The CSV preserves the input rows; the ECharts JSON contains drawing options.
What this example cannot tell you
These constructed groups do not show an intervention effect. A box plot alone does not establish pairing, random assignment or statistical significance. Values below zero are not proof of poor performance without knowing the meaning of the measure.
Does a negative median cause a problem for a box plot?
No. Quartiles are ordered numeric positions and can be negative, zero or positive. The IQR remains Q3 minus Q1, a nonnegative spread. There is no need to offset all values upward just to draw the box.
Calculation convention
The default uses linear interpolation at rank (n − 1)p in the sorted sample, equivalent to R quantile type 7. At p = 0.25, 0.5 and 0.75 this gives Q1, the median and Q3. The alternate method takes medians of the lower and upper halves, excluding the middle observation when the sample size is odd. These methods can give different results for the same small sample.
Method background: NIST: box plot and fence interpretation. R documentation: quantile methods.
Created by SupaMakers for ChartsAI · September 8, 2026. Source and reuse terms.