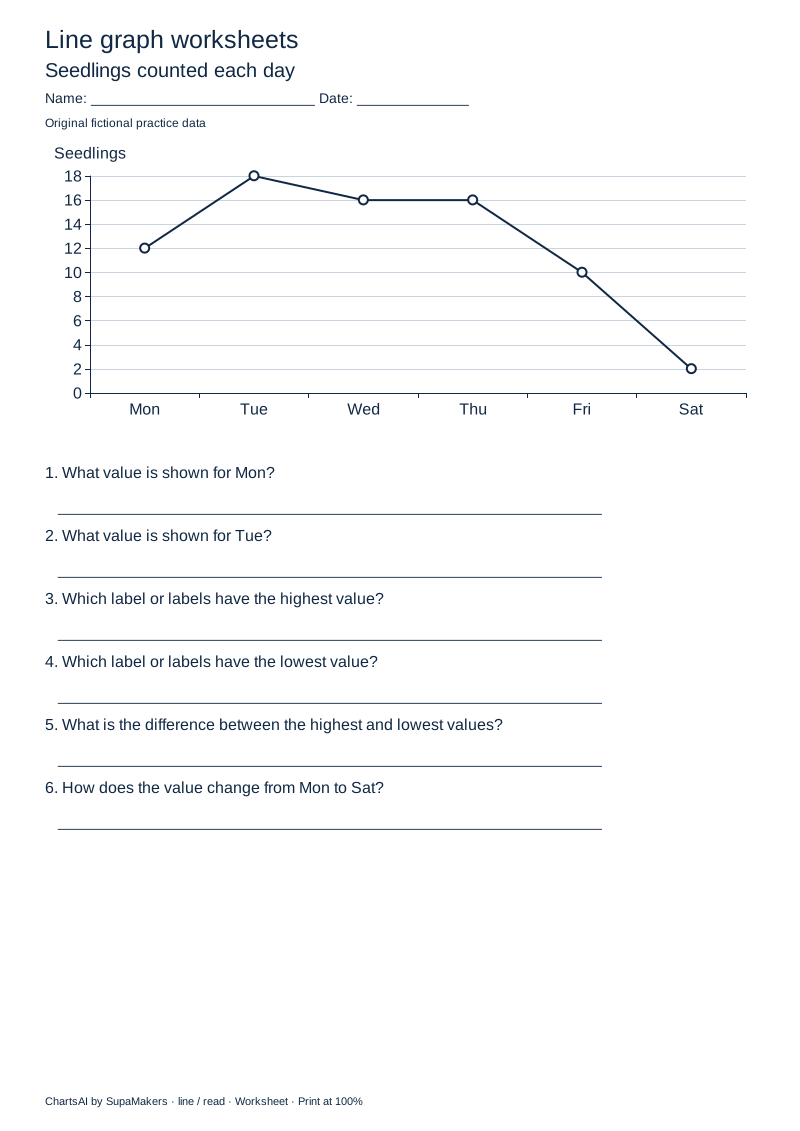
Read the chart
Read points, find the highest and lowest values, calculate a range and describe first-to-last change. Six questions establish careful scale reading.
Practice reading a line graph, finding changes and plotting a sequence of observations. Download original PDF practice sheets or replace the values, then print the questions and a separate answer key.
Fictional practice data. 6 labelled values.
Select one label column and one value column, with 3–8 rows and whole numbers from 0 to 100.
Question page · Print at actual size (100%). Updating preview…
Seedlings counted each day · Seedlings. Labels are equally spaced and stay in the supplied order.
| Label | Seedlings |
|---|---|
| Mon | 12 |
| Tue | 18 |
| Wed | 16 |
| Thu | 16 |
| Fri | 10 |
| Sat | 2 |
Question downloads always hide answers, even when you preview the key. PDFs contain high-resolution page images.
A line graph plots values in a specified order and connects consecutive points. Read the point values against the vertical scale, then compare adjacent points to identify increases, decreases and unchanged intervals.
Use 3–8 distinct labels, each up to 18 characters, and one whole-number value from 0 to 100 per label. Labels are equally spaced in the supplied order. Use equally spaced observations for time-based practice; irregular time intervals belong in the general line-graph maker.
Original fictional examples. Each PDF contains one question page and one answer-key page. Download without signing in or enabling JavaScript.
Read points, find the highest and lowest values, calculate a range and describe first-to-last change. Six questions establish careful scale reading.
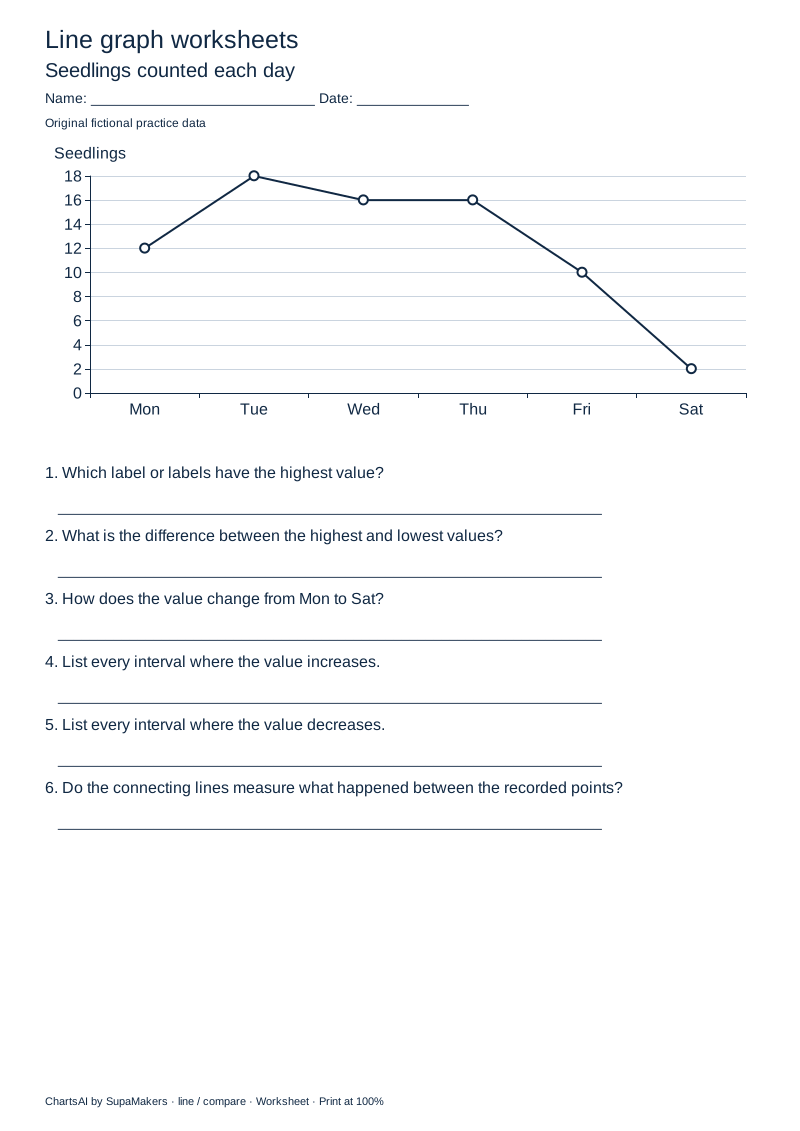
Compare changes, list increasing and decreasing intervals, and explain why connecting lines do not establish intermediate measurements. Six questions with worked answers.
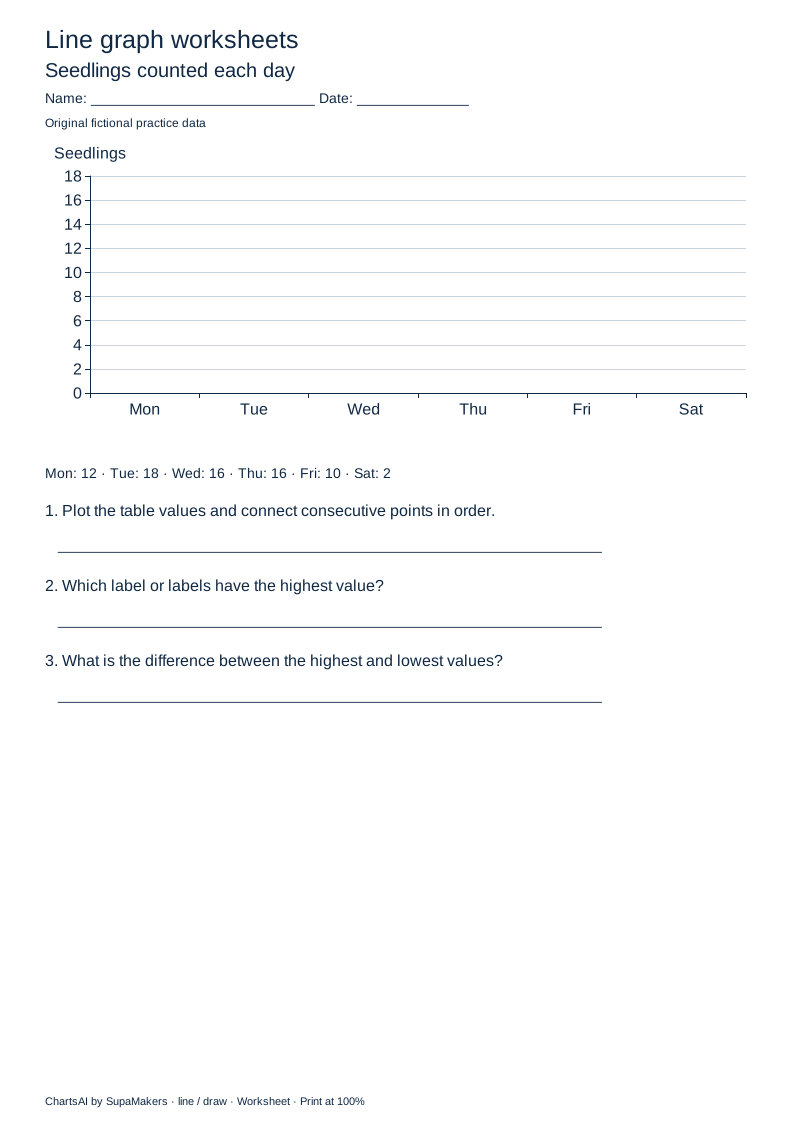
Plot values from a table and connect consecutive points in order, then identify the highest value and range. Three tasks with a matching completed graph.
Seedlings counted each day · Seedlings. Mon: 12; Tue: 18; Wed: 16; Thu: 16; Fri: 10; Sat: 2. These are fictional practice values, not findings or benchmarks.
Points remain in the supplied label order, with equal horizontal spacing and a vertical baseline of zero. No smoothing, resampling or implicit aggregation occurs.
First-to-last change is last value minus first value. Positive change is an increase; negative change is a decrease. Adjacent equal values are neither increasing nor decreasing.
A connecting segment is a visual connection between observations. It does not prove unrecorded intermediate values, and the overall change can hide increases and decreases within the sequence.
The graph and worksheet use native Apache ECharts axes and marks. Question and answer exports share the same values and scale. PDF pages contain high-resolution images; use the accessible text view or CSV downloads for selectable values and answers. There is no automated grading or curriculum-certification claim.
Yes. Uncheck “Include a separate answer-key page” before downloading a customized PDF. For ready-made packs, print only page 1. The worksheet SVG also contains questions only.
Yes, within the limits above. Choose “Upload a file” or “Paste data”, select the relevant columns, and review before replacing the current values. The imported data and generated files stay in your browser. Replacing a sample removes its fictional-data label.
Yes. Question values, ties, comparisons and worked answers are derived from the current chart data. Changing paper size preserves the dataset. “Generate fresh data” intentionally replaces it with a new fictional practice set.
Yes. Print and share these original worksheets for classroom or home practice, without an account or a watermark across the work. ChartsAI is a free, open-source project by SupaMakers.
Need a standalone graphic or more flexible data? Use the line graph maker. Explore chart guides, number line worksheets, or dot plot worksheets and bar graph worksheets..